Heatmaps are a new visualization for Application Metrics that show both the distribution of metric values and how those distributions change over time, useful for spotting patterns like latency correlating with request bursts. Available in Custom Dashboards for the Application Metrics dataset.
Sentry Changelog
Mon
Wed
Fri
JulAugSepOctNovDecJanFebMarAprMayJunJul
LessMore
Releases34Avg10/moVersionsv10.51.0 to v10.55.0
The sentry_grpc package adds gRPC instrumentation for Dart and Flutter apps, tracing calls, recording breadcrumbs, propagating traces to backends, and capturing failed calls as errors.
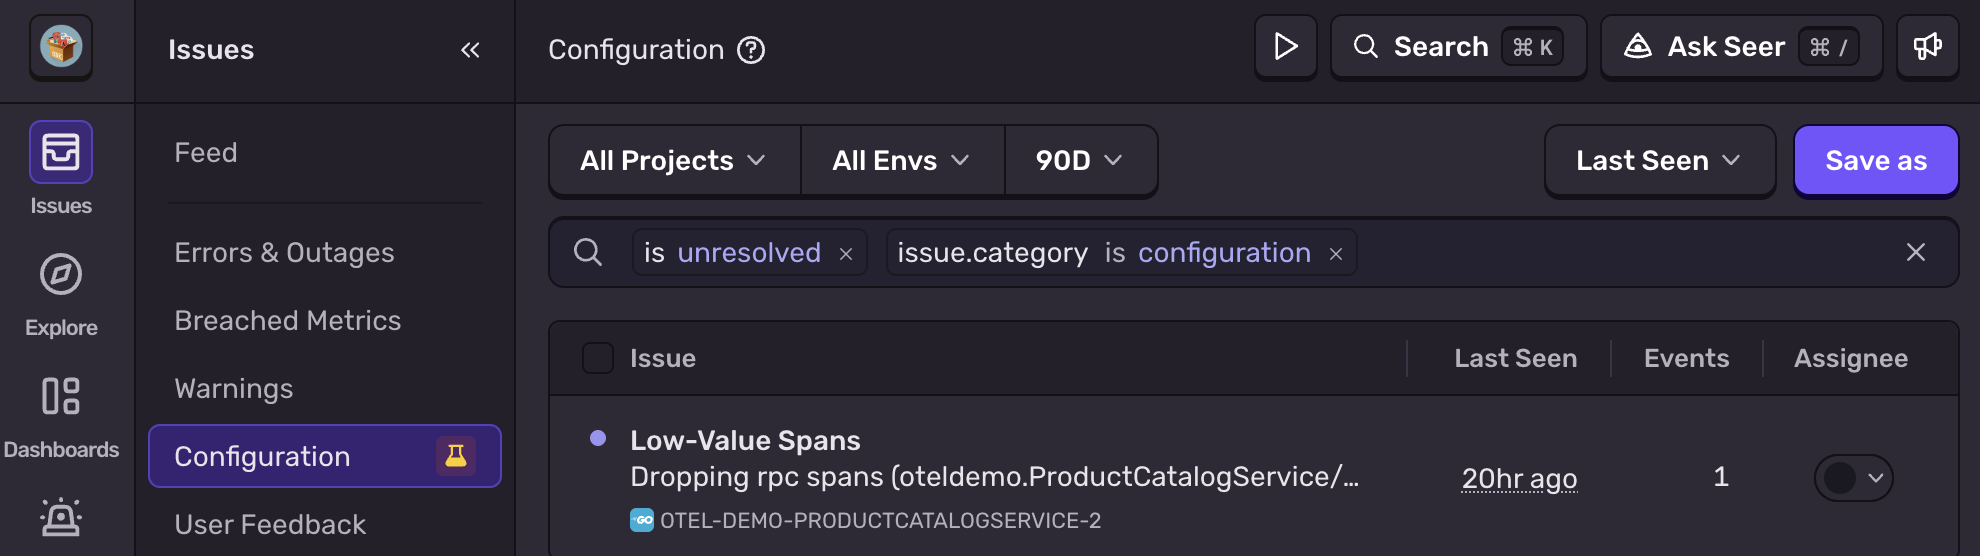
Sentry now detects spans that are high-volume but low-signal and surfaces them as a new issue type in Issues → Configuration. Each low-value span issue shows projected 30-day volume, estimated storage cost, average duration, and troubleshooting guidance to remove the span via SDK auto-instrumentation settings or custom code; Seer can apply fixes automatically.
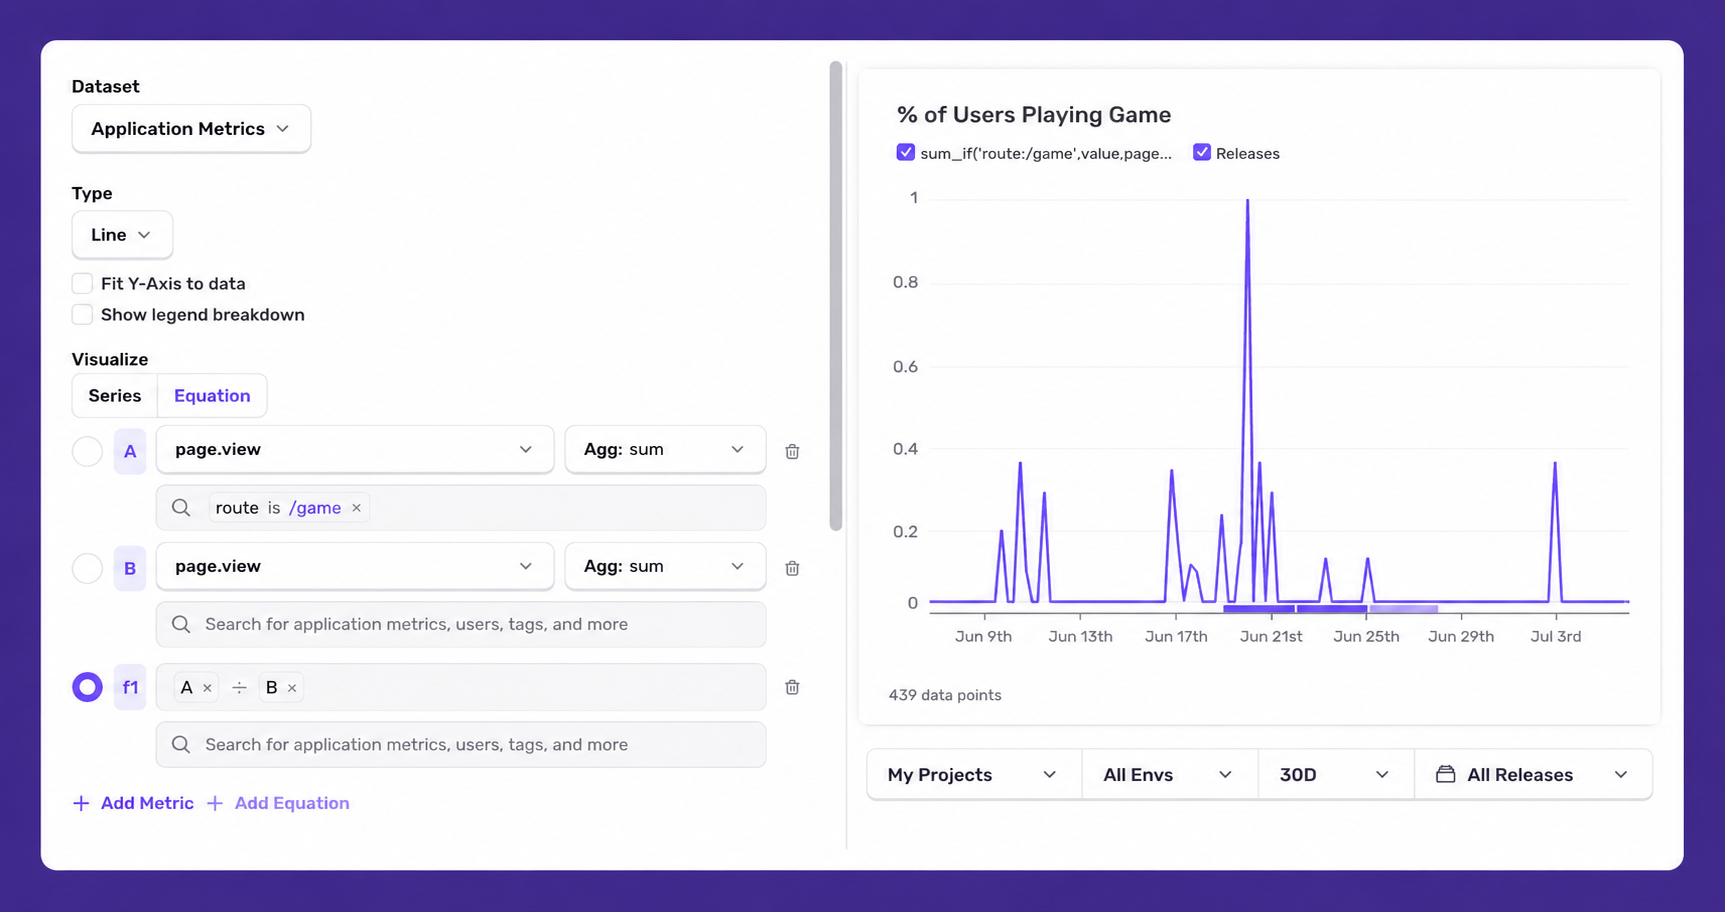
Custom Dashboards now support equations for the Application Metrics dataset, allowing you to combine multiple metrics into formulas—from simple calculations like error percentages to complex ones like Apdex scores. Save equations from Explore to a Dashboard or create equation-backed widgets directly from the Dashboard interface.
Seer root cause analysis can now be sent to GitHub Copilot, which generates a fix and pull request linked back in Sentry. Available for Copilot Pro, Pro+, Business, and Enterprise users.
Gen_AI spans now stream as streamed v2 spans by default, preventing drops on large transactions and removing AI message truncation. Fixed FastAPI sync handler double-wrapping on ≥0.137, and URL fields are now consistently gated behind send_default_pii across integrations.
In Explore → Logs, you can now export up to 10,000 log lines in CSV or JSONL format, with the option to include all columns.
Sentry Snapshots, now in Open Beta, catches unintended visual changes on every pull request by diffing uploaded screenshots and posting results to the PR. Agents can also access diffs locally or via Sentry's MCP server.
Starting with release 10.58.0, internal JavaScript SDK packages have moved from the @sentry-internal/* scope to the @sentry/* scope. Most users will not need to take action, as package managers will resolve updated dependencies during normal SDK upgrades. Changes are only needed if you directly depend on, import from, or pin these internal packages. This change clarifies package ownership and consolidates packages under one organization namespace.
Sentry upgraded its AI model for issue grouping, which reduces incorrect merges by 50% and duplicate issues by 20%. The new model is trained on real Sentry stack traces and calibrated to err on the side of separation, meaning issues in your feed are more likely to represent distinct problems.
10 new API endpoints are now documented, including tracing, profiling, and attachments endpoints. Optional parameters are now documented across endpoints, and OpenAPI spec mismatches—including required vs. optional field inconsistencies and incorrect response types that broke generated clients—are fixed.
Command Palette (Cmd+K / Ctrl+K) now supports bulk actions on issues—archive, resolve, or assign multiple issues at once—and exposes the full set of single-issue actions including assign, resolve, archive, priority change, stack trace copy, and Seer handoff. DSN lookup works both directions: find a DSN by project name or find a project by pasting a raw DSN string. Large organizations benefit from faster project navigation via search.
v10.55.0
The @sentry/hono SDK is now stable, and honoIntegration is deprecated. The dedicated SDK provides instrumentation tuned to Hono's routing and middleware, enabling error monitoring, distributed tracing, profiling, metrics, and logs across Node.js, Cloudflare Workers, and Bun runtimes.
Codecov data is no longer available in Sentry.
Sentry's Slack integration now provides previews for Explore and Dashboard charts.
Sentry's AI-Detected Issues feature is now generally available, using AI to analyze traces and logs to detect issues like database inefficiencies, blocking operations, and security concerns that traditional pattern-matching would miss.
AI-Detected Issues is now generally available, using AI to analyze traces and logs to detect database inefficiencies, blocking operations, and security concerns that traditional pattern-matching would miss.
Conversations is now in open beta for all Sentry users, providing a readable view into past sessions with your agent, including the full exchange of messages and tool calls.
Fixed a regression in data scrubbing that prevented http.query, url.query, and url.full span attributes from being scrubbed.
Sentry Seer can now send identified root causes to GitHub Copilot to generate fixes. The feature is in open beta.
Last Checked
54m ago
Latest
Jul 16, 2026
Source
sentry.io/changelog