Memory usage charts now in Workers Metrics tab
You can now monitor how much memory your Workers and Durable Objects consume across invocations with the new Memory Usage chart in the Workers Metrics tab, broken down by P50, P90, P99, and P999 percentiles.

Memory usage measures the V8 isolate memory at the time of each invocation, subject to the 128 MB per-isolate limit — a single isolate can handle many concurrent requests and shares memory across them.
Use the Memory Usage chart to:
- Track memory trends — Spot gradual increases that may indicate a memory leak before they cause
Exceeded Memoryerrors. - Correlate with deployments — Deployment markers on the chart help you identify whether a new version introduced a memory regression.
- Right-size your Worker — Understand your baseline memory footprint and how much headroom you have before hitting the 128 MB limit.
For Durable Objects, memory usage reflects the in-memory state an object holds (class properties, caches, active WebSocket connections), which persists across invocations until the object is hibernated or evicted. This state is not preserved across eviction, hibernation, or a crash, so persist anything important to storage.
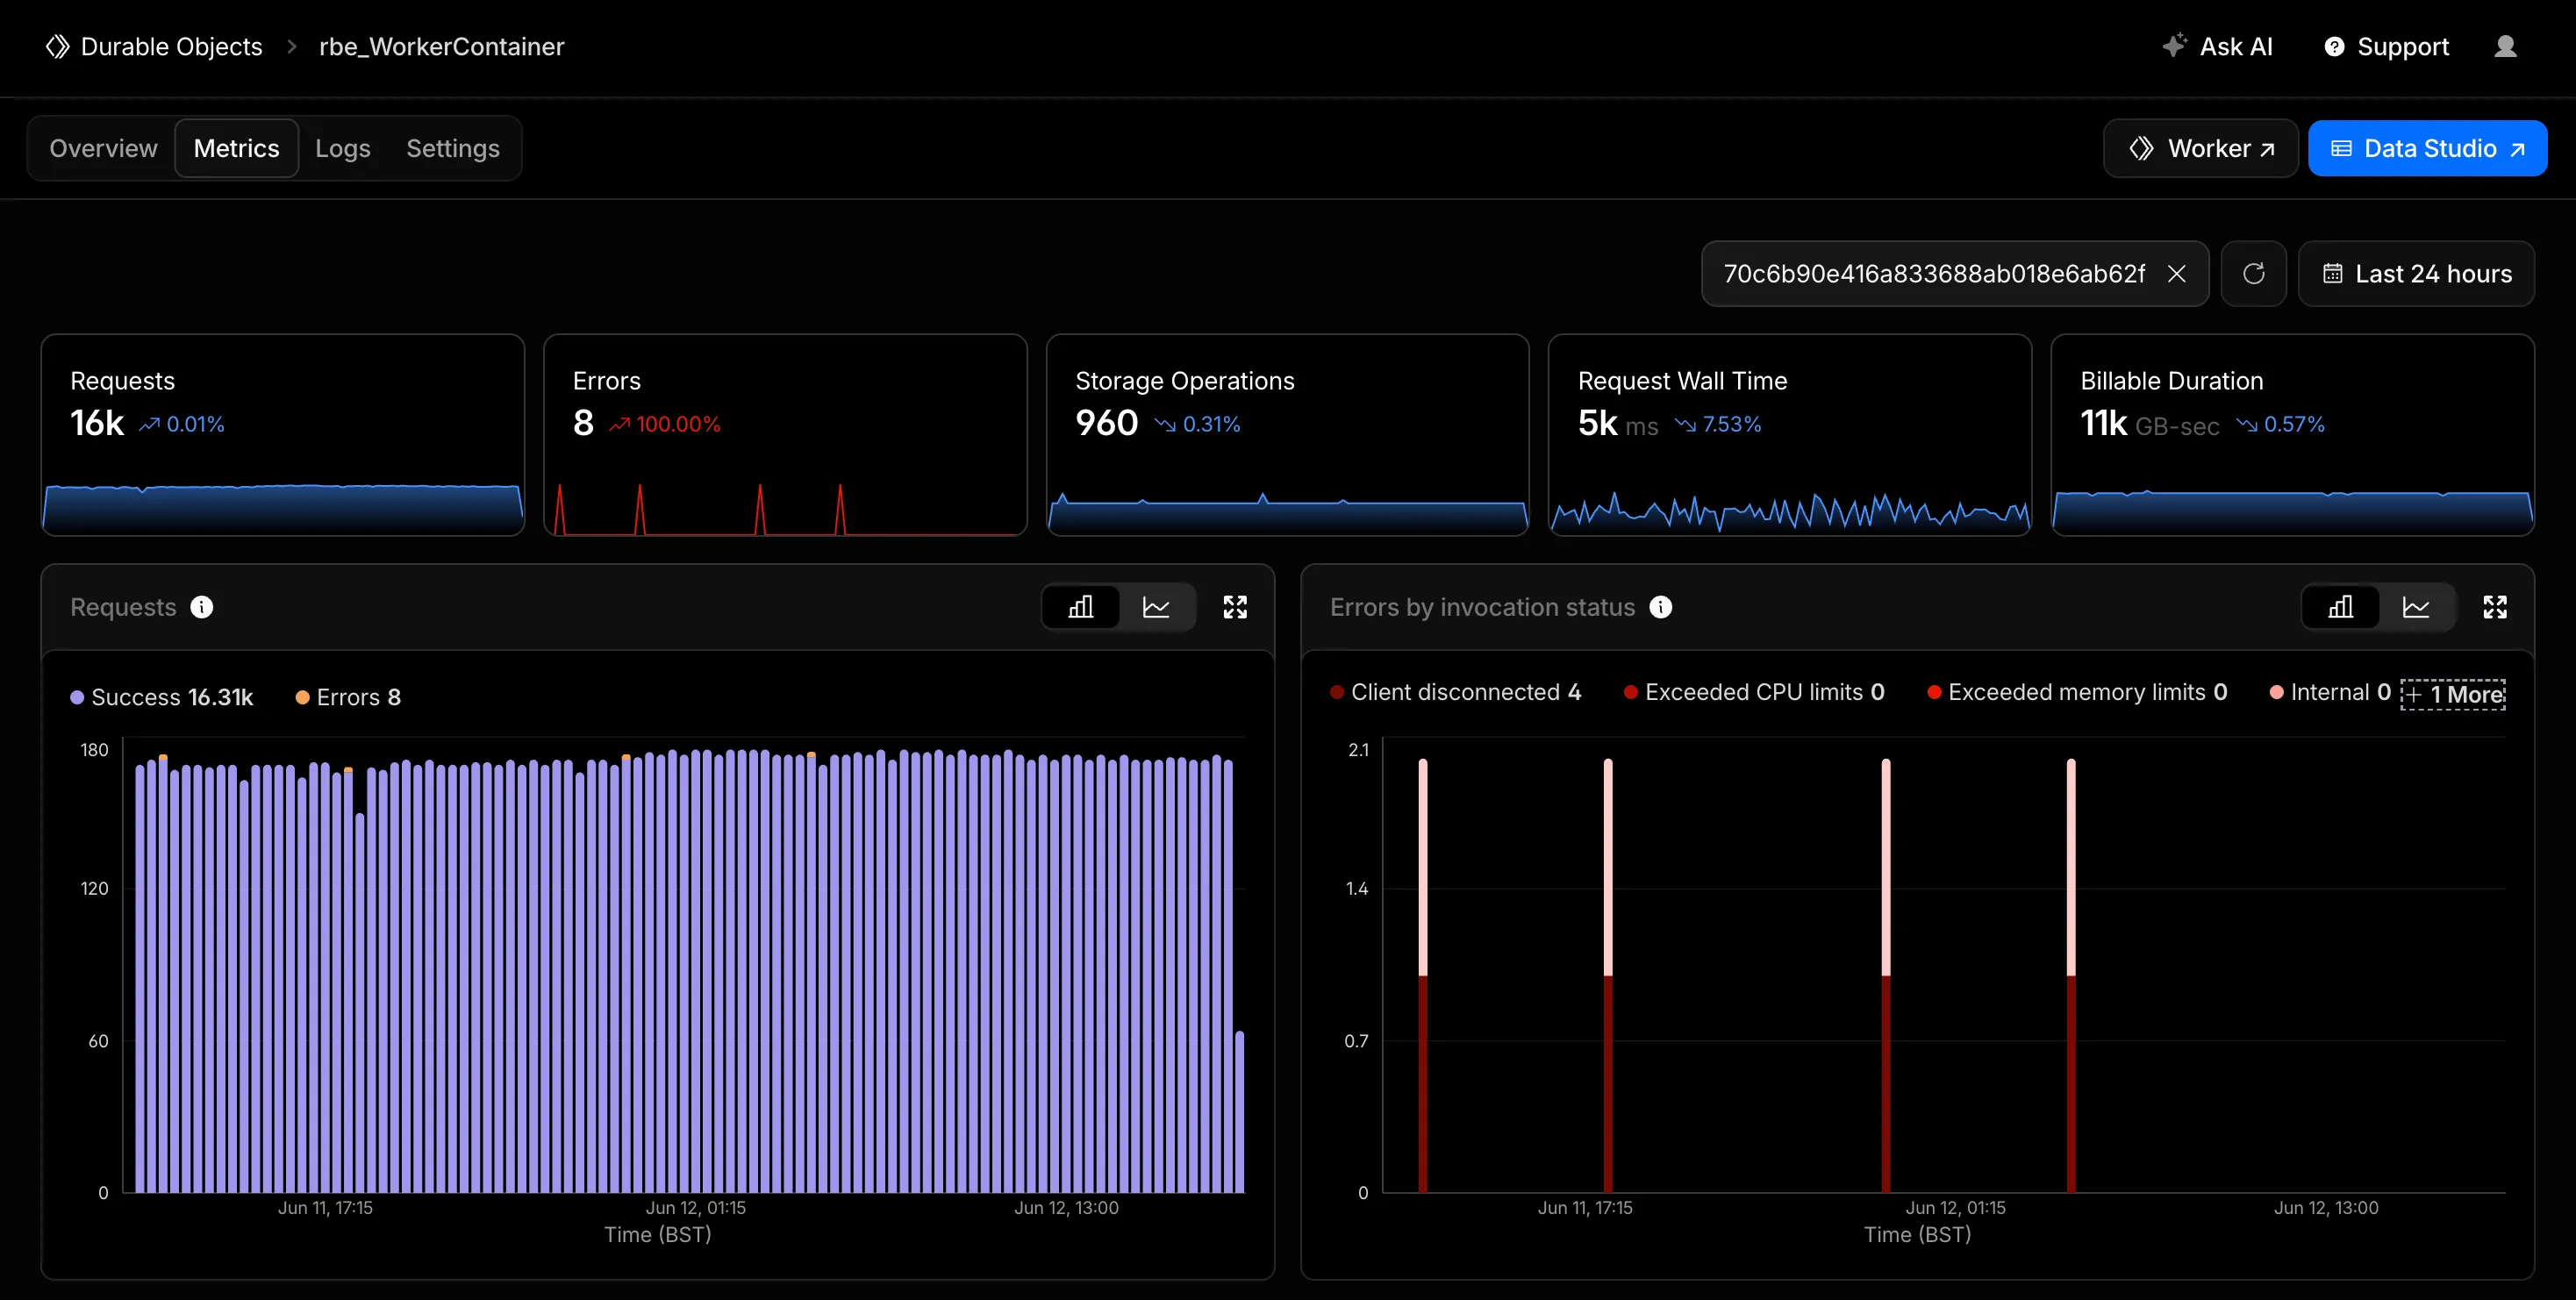
To view memory usage, open the Metrics tab for your Worker or Durable Object namespace. For Durable Objects, you can filter by DO ID or name to drill down into memory usage for a specific object. You can also query memory usage programmatically via the GraphQL Analytics API using the workersInvocationsAdaptive dataset — the quantiles.memoryUsageBytesP50 through quantiles.memoryUsageBytesP999 fields return percentile values in bytes.
For local memory debugging, you can also profile memory with DevTools to take heap snapshots and identify specific objects causing high memory usage.
Fetched July 1, 2026