releases.shpreview
Dash0/Dash0 Changelog

Dash0 Changelog

Mon
Wed
Fri
JunJulAugSepOctNovDecJanFebMarAprMayJun
Less
More
Releases35Avg12/mo

The old assistant has been replaced by an autonomous production AI built on a new execution runtime, with continuous environment scanning, full-loop investigation, and pull request generation against your codebase.

Key capabilities

  • Continuous environment scanning — surfaces failing services, infrastructure pressure, and deployment correlations
  • Integrated contextual experience across Dash0 features
  • Parallel capabilities including environment scanning, Q&A, multi-signal correlation, and asset generation
  • Sandboxed execution runtime — similar in architecture to Claude Code
  • Full-loop incident response — root cause identification to commit level and PR drafting
  • Validated dashboards and alerts against live telemetry
  • Native integrations: GitHub, Linear, Confluence, SQL, Bash, and MCP servers
  • Service-centric chat interface redesign
  • Task-based credit pricing model

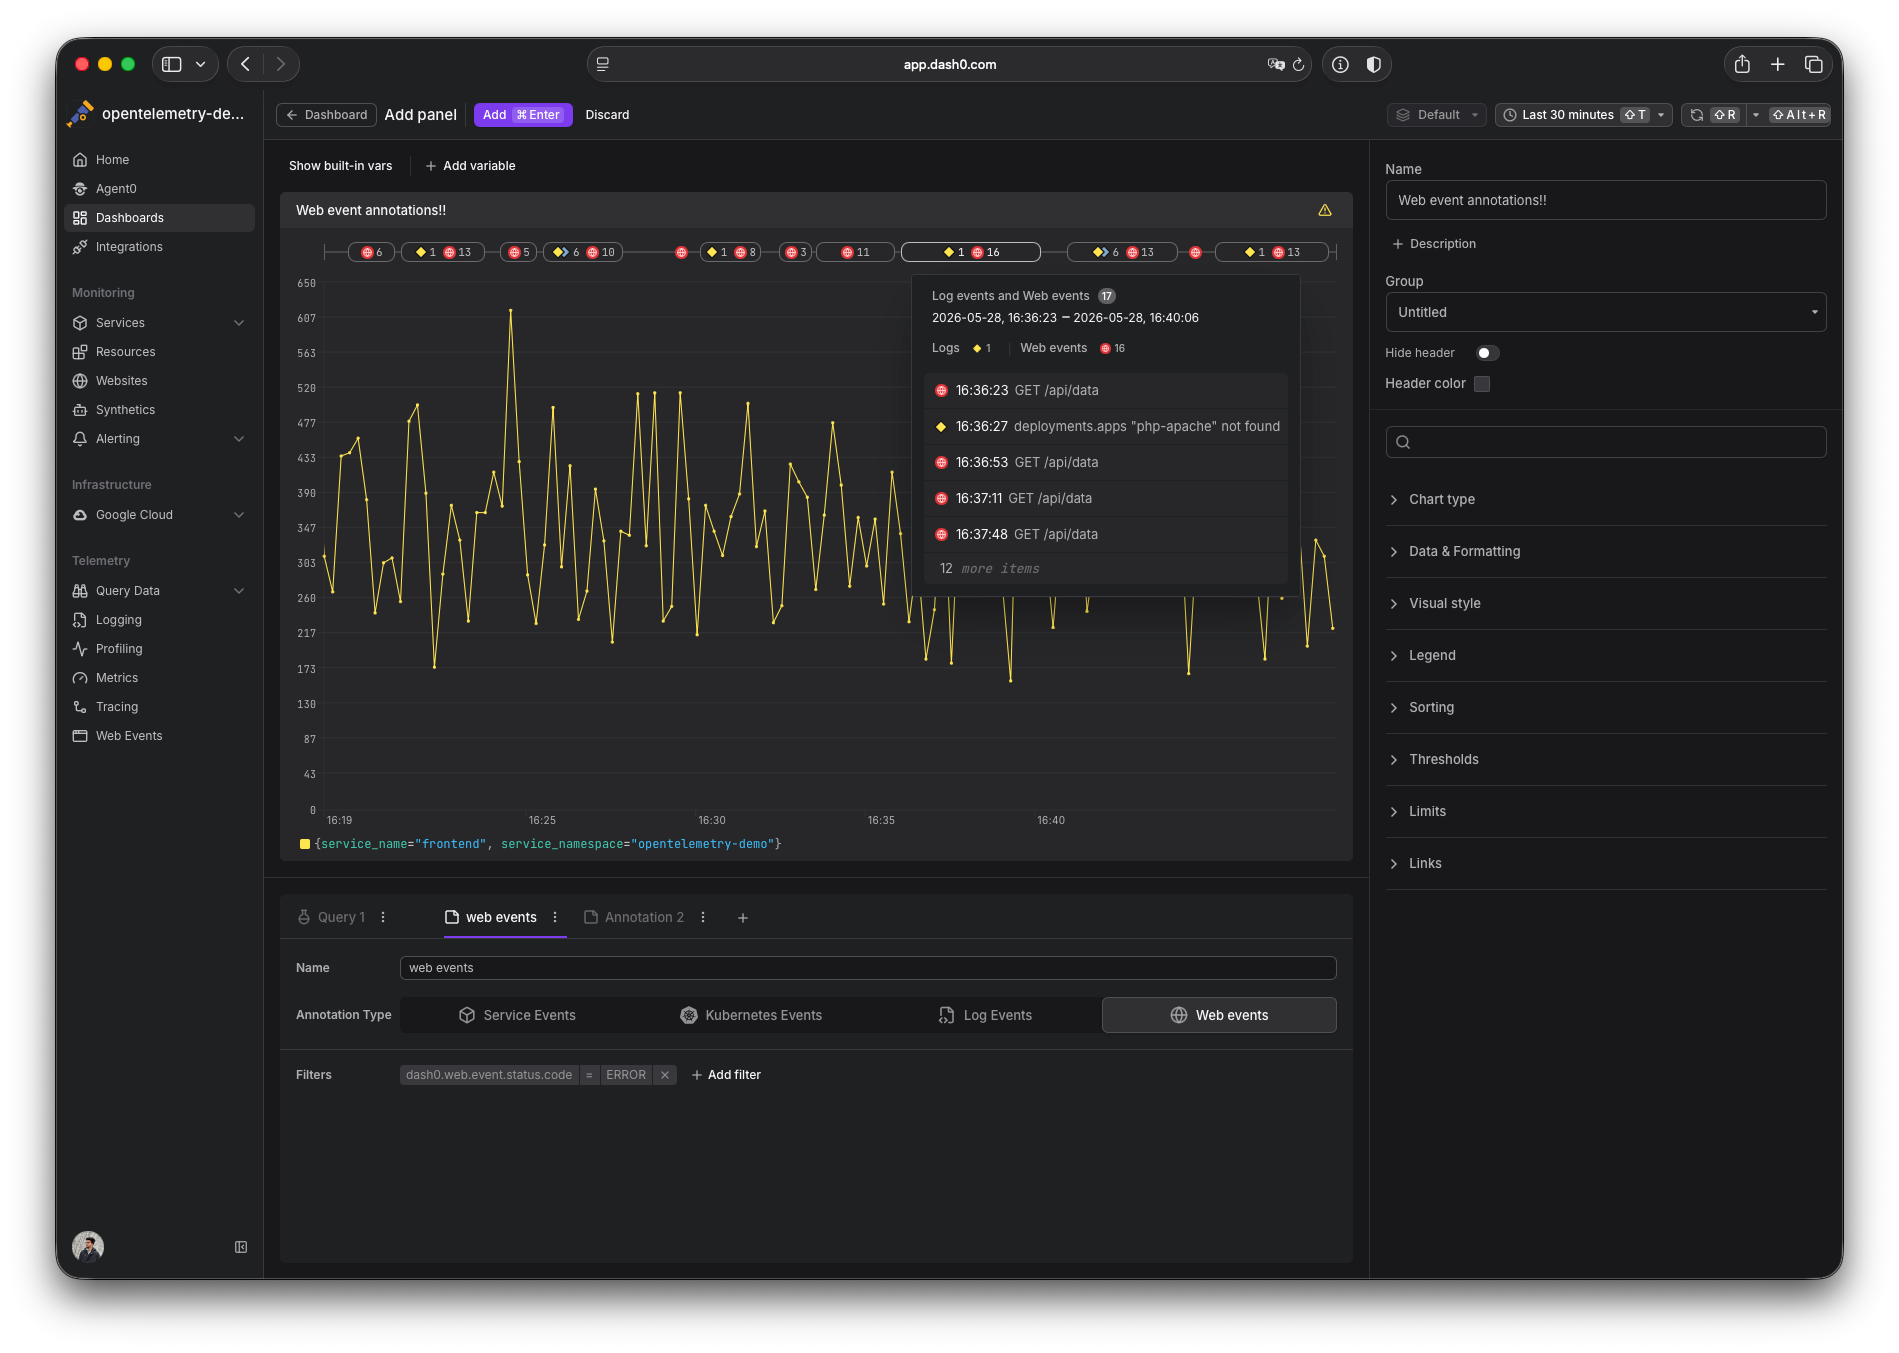
Dash0 now supports web event annotations on time-series charts, letting you correlate spikes and dips in your time-series charts with what real users were doing.

Real User Monitoring (RUM) web events can be overlaid on time-series dashboard widgets alongside existing annotation sources such as logs, Kubernetes events, and service events.

Features:

  • Apply filters consistent with the Web Events Explorer interface
  • View matching events as markers on chart timelines
  • Clustered markers collapse into grouped pills by event type, maintaining visual distinction between event categories
  • Chart legends include a dedicated "Web events" row with separate event counts
  • Each marker displays a tooltip with event attributes and provides one-click navigation to the Web Events Explorer with filters and selections preserved, enabling rapid navigation from dashboard observations to detailed session analysis

Dash0 expanded its Kubernetes monitoring capabilities by introducing support for new OpenTelemetry semantic conventions and improving the k8sobjectsreceiver integration.

New Resource Types

The OpenTelemetry K8s SIG introduced new semantic conventions for multiple Kubernetes resource types. Dash0 added support for replication controllers, horizontal pod autoscalers, persistent volumes and claims, and resource quotas through new resource types:

  • k8s.replicationcontroller
  • k8s.service
  • k8s.persistentvolume
  • k8s.persistentvolumeclaim
  • k8s.hpa
  • k8s.resourcequota

A generic k8s.object resource type was also added for Kubernetes resources lacking existing semantic conventions, including CRDs.

k8sobjectsreceiver Enhancements

The k8sobjectsreceiver generates log records for Kubernetes API state changes. Dash0 improved this by extracting resource attributes from log bodies — such as pod names, UIDs, and node information — to better associate logs with their corresponding resources.

Key improvements include:

  • Extraction of k8s.* attributes from log message bodies for proper resource association
  • Replacement of placeholder fields with semantically meaningful k8s.object designations
  • Support for dashboard annotations based on Kubernetes resource changes
  • Normalization of Kubernetes event formats between different receivers
  • UTC timestamp standardization for the k8seventsreceiver

These enhancements allow users to overlay Kubernetes resource modifications against telemetry data for improved observability.

When troubleshooting slow or failing database queries, knowing which query ran is the first thing you need, but finding it buried in the Attributes tab is painful. Now it's front and center in the span sidebar, syntax-highlighted, with prepared statement parameters already filled in.

Making database queries easy to find

A dedicated query widget was added to the span sidebar. If a span is a database span — carrying either the db.query.text or legacy db.statement attribute — the query appears prominently with syntax highlighting. No more hunting through tabs.

Query parameters for prepared statements

Several OpenTelemetry instrumentations for Java, .NET, and Python collect prepared statement parameters as db.query.parameter.<id_or_key> span attributes. These values are interpolated directly into the query so users can read it as it actually ran.

The interpolated parameters are interactive: filter them in or out, inspect individual values, copy to clipboard, or pin as a span table column.

Enabling query parameters with the Dash0 Operator for Kubernetes

Starting with Operator v0.141.0, the Dash0 Operator supports capturing query parameters via instrumentWorkloads.captureSqlQueryParameters: true in the Dash0Monitoring resource. This enables parameter collection for injected Java and .NET instrumentations. Python requires code-level configuration; other languages can use custom instrumentations.

Not using the Dash0 Operator, or libraries that collect database query parameters?

The Agent Skills (v1.3.0) help configure parameter collection for Java, .NET, and Python apps, plus custom instrumentations for languages lacking built-in support.

When you spot something unusual in a chart — a sudden spike in a logs chart, a latency outlier, an error rate climbing on one service — the next question is always the same: which records actually caused this? Dash0 now gives you a direct way of answering this question. Select a time range or on a chart, click a pie segment, or click a stat value, and an action bar appears with Explore and Triage actions that take you straight into the matching signal explorer with filters and time scope already applied.

What's New

  • Inline drilldown from any chart — Time-series, pie, gauge, stat, and tree-map charts now drill straight into the records behind them.
  • Searchable picker for multi-time-series charts — Charts with many series open a dialog with live counts of matching records per series and full keyboard navigation.
  • Per-(series × signal) drilldowns — Multi-series and multi-signal charts produce independent drilldowns, each scoped to its row's labels and its signal's filters.
  • Explore and Triage modes — Read records with Explore, or surface what differentiates them with Triage. Available for spans, logs, and web events.
  • Filter and time-range carry-over — Filters from PromQL and series labels and your selected time range follow you into the destination explorer with no manual setup.

Why This Matters

Exploring data behind a chart used to mean hopping between a dashboard, the spans explorer, the logs explorer, and a metric drilldown with manual filter copying. The new feature collapses this workflow into a single action.

Try It

Open any dashboard and select a time range on a chart to access Explore or Triage actions. Documentation

The Integrations Hub now includes 101 curated check (alerting) rules covering technologies like Kubernetes, Vercel, AWS RDS, Istio, Argo CD, Cilium, the OpenTelemetry Collector, and many more.

Setting up alerting for a new technology has always been the slow part of getting full coverage. Rather than manually configuring PromQL expressions, thresholds, and severity levels from scratch, these pre-built rules handle that automatically.

Key capabilities:

  • Browse rules publicly at dash0.com/hub before signup
  • One-click installation from in-app integration pages
  • Pre-configured PromQL expressions with sensible thresholds and severity levels
  • Transparent documentation showing what each rule does and its required metrics and dependencies
  • Visibility into which metrics are already flowing to your organization
  • Rules are disabled by default to prevent immediate alert spam
  • Full customization available after installation — edit, route, and adjust thresholds as needed

The Hub is designed as a curated starting point, not a black box.

Dash0 now supports managing spam filters through Infrastructure as Code tooling. Teams can define and manage spam filters — which drop unwanted logs, spans, and metrics before they reach storage by matching on structured attribute conditions — via three methods:

Dash0 CLI (experimental, requires -X flag)

dash0 spam-filters create -X --dataset default -f drop-health-checks.yaml
dash0 spam-filters list -X --dataset default
dash0 spam-filters get -X --dataset default <id>
dash0 spam-filters update -X --dataset default <id> -f drop-health-checks.yaml
dash0 spam-filters delete -X --dataset default <id>

Terraform Provider

resource "dash0_spam_filter" "drop_health_checks" {
  dataset          = "default"
  spam_filter_yaml = file("${path.module}/filters/drop-health-checks.yaml")
}

Kubernetes Operator

apiVersion: operator.dash0.com/v1alpha1
kind: Dash0SpamFilter
metadata:
  name: drop-health-checks
  namespace: monitoring
spec:
  contexts:
    - log
  filter:
    - key: "k8s.namespace.name"
      value:
        stringValue:
          operator: "equals"
          comparisonValue: "kube-system"

The Spam Filters UI was also updated to support naming filters and downloading their YAML configuration for use across all three provisioning methods. Additional spam filter capabilities are expected in the coming weeks.

Dashboard queries that aggregate large volumes of raw metrics can be slow and expensive.

You can now define recording rules as code using the Dash0 CLI, Terraform provider, and Kubernetes operator, so pre-computed time series are version-controlled and deployed alongside the rest of your infrastructure.

Recording rules let you evaluate PromQL expressions on a schedule and store the results as new time series. This means dashboards and alerting rules can query the pre-computed series instead of recalculating them on every load. You author rules in the standard PrometheusRule CRD format (monitoring.coreos.com/v1), so the syntax is already familiar if you have worked with the Prometheus Operator.

How it works

Each recording rule is scoped to a dataset and defined as a YAML document that follows the PrometheusRule specification. Inside the YAML you declare one or more rule groups, each with an evaluation interval and a list of rules entries that pair a record name with a PromQL expr. Dash0 evaluates these expressions on the configured cadence and writes the resulting series back into the dataset, ready for dashboards and alert conditions.

Dash0 CLI
# Create recording rules from a YAML file
dash0 recording-rules create --dataset default -f recording-rules.yaml

# List all recording rules in a dataset
dash0 recording-rules list --dataset default

# Get a single recording rule by ID
dash0 recording-rules get --dataset default <id>

# Update an existing recording rule
dash0 recording-rules update --dataset default <id> -f recording-rules.yaml

# Delete a recording rule
dash0 recording-rules delete --dataset default <id>
Dash0 Terraform Provider
resource "dash0_recording_rule" "http_metrics" {
  dataset            = "default"
  recording_rule_yaml = file("${path.module}/rules/http-recording-rules.yaml")
}
Dash0 Operator for Kubernetes
apiVersion: operator.dash0.com/v1alpha1
kind: Dash0RecordingRule
metadata:
  name: http-recording-rules
  namespace: monitoring
spec:
  dataset: default
  content: |
    apiVersion: monitoring.coreos.com/v1
    kind: PrometheusRule
    metadata:
      name: my-recording-rules
    spec:
      groups:
        - name: http_metrics
          interval: 1m
          rules:
            - record: http_requests:rate5m
              expr: rate(http_requests_total[5m])

The operator syncs the recording rule to Dash0 and reports status back on the custom resource.

Keeping alerting configuration in sync across environments has always been tedious. You can now manage notification channels — Slack, PagerDuty, email, webhooks, and more — as code using the Dash0 CLI, Terraform provider, and Kubernetes operator.

Notification channels control where Dash0 sends alerts when check rules fire. Until now they could only be configured through the UI, which made it difficult to version-control, review, and replicate them across organizations. With IaC support, you define a channel once in a YAML file and apply it from your terminal, CI/CD pipeline, or GitOps workflow.

How it works

Each notification channel is defined as a CRD-enveloped YAML document with kind: Dash0NotificationChannelCopy. The spec.typeCopy field selects the channel type (one of 17 supported integrations), and spec.configCopy holds the type-specific settings such as webhook URLs or Slack channel names. Notification channels are organization-level resources, so no --datasetCopy flag is required.

Dash0 CLI

Available since v1.9.0:

# Create a notification channel from a YAML file
dash0 -X notification-channels create -f slack-alerts.yaml

# List all notification channels
dash0 -X notification-channels list

# Get a single notification channel as YAML
dash0 -X notification-channels get <id> -o yaml

# Update an existing notification channel
dash0 -X notification-channels update <id> -f slack-alerts-updated.yaml

# Delete a notification channel
dash0 -X notification-channels delete <id>

Terraform provider

Available since v1.8.0:

resource "dash0_notification_channel" "slack_alerts" {
  notification_channel_yaml = file("${path.module}/channels/slack-alerts.yaml")
}

Import existing channels with terraform import dash0_notification_channel.slack_alerts <origin>.

Kubernetes operator

Available since v0.136.0:

apiVersion: operator.dash0.com/v1alpha1
kind: Dash0NotificationChannel
metadata:
  name: slack-alerts
  namespace: monitoring
spec:
  content: |
    kind: Dash0NotificationChannel
    metadata:
      name: Slack Alerts
    spec:
      type: slack
      config:
        url: "https://hooks.slack.com/services/T00/B00/xxxx"
      frequency: 10m

The operator syncs the channel to Dash0 and reports status back on the custom resource.

Dash0 SQL is now generally available. Write queries directly against your logs, spans, and web events — with templates to start fast, query history to revisit past work, and saved views to persist queries and share with your team.

Full SQL Support

SQL queries across logs, spans, and web events, including joins, subqueries, and aggregations. Available functions span aggregation, string manipulation, date operations, array handling, math, logic, JSON extraction, and type conversion. Use AI tools to generate queries by describing desired outcomes.

Built-in Query Templates

A library of ready-to-run examples helps users avoid starting with blank queries.

Recent Queries

The platform maintains local history of the last 20 queries executed.

Saved Views with Sharing

Persist named queries in Dash0 and share them with team members across sessions and devices.

See also: SQL function reference

Running multiple sites on a shared web integration now allows visibility into which domain each session originated from. The page.url.domainCopy attribute surfaces in three locations:

  1. Session list sidebar — Domain displays alongside location and browser information for quick identification
  2. Session detail page — Domain appears in the header while reviewing page views and events
  3. Dashboard filters — New Domain filter variable available in Overview and Web Vitals dashboards for network-wide metrics segmentation

Additional improvements: Session detail header items now wrap gracefully on smaller screens rather than becoming compressed.

Need more room for that service name? Now you can drag column edges to resize tables in Trace Explorer, Log Explorer, Web Events Explorer, and Resources.

We've added drag-to-resize handles to table columns across Dash0's explorers. Hover over the table header row to reveal grip handles at column edges, then drag to adjust the width. Save your view to keep your preferred column sizes across sessions.

To reset column sizes, use the view reset button. If you've saved a view with custom column sizes, a "Reset column sizes" button will appear in the table Settings menu.

Available in: Trace Explorer, Log Explorer, Web Events Explorer, and Resources.

Connecting your AI coding tools to Dash0 just got a lot simpler. Dash0's MCP server now supports OAuth 2.0 authentication, so tools like Claude Code, Cursor, Windsurf, and other MCP-compatible clients can authenticate without requiring you to create and manage static API tokens.

How It Works

When you add Dash0 as an MCP server in your AI tool of choice, the tool will automatically open a browser window where you log in and grant consent — just like connecting any other app. Behind the scenes, Dash0 handles dynamic client registration, token exchange, and automatic refresh. You never touch a token.

For example, in Claude Code

claude mcp add --transport http dash0 {{endpoint_mcp}}

That's it. Claude Code will walk you through the OAuth flow on first use.

Why This Matters

  • No more token management. You don't need to visit the Dash0 UI to create an auth token, copy it into your config, and remember to rotate it.
  • Short-lived, auto-refreshing tokens. Access tokens expire in 15 minutes and refresh automatically - reducing the blast radius if a token is ever compromised.
  • Full audit trail. Every OAuth authorization, token exchange, and revocation is tracked in your organization's audit log.
  • Revocable at any time. You can review and revoke connected applications from your Dash0 settings (User Settings -> Applications).

What You Get

Once connected, your AI tool has access to 20+ MCP tools for querying your observability data - service catalogs, PromQL metrics, logs, traces, synthetic checks, dashboards, and more. All scoped to your user permissions and dataset access.

Traditional Tokens Still Work

If you prefer managing tokens yourself - for CI pipelines, scripts, or automated workflows - bearer token authentication remains fully supported. OAuth is an additional option, not a replacement.

Chart legends now behave the same way everywhere in Dash0.

Click a legend entry to isolate that series — all other series are hidden so you can focus on the one that matters. Shift+click to select multiple series and build the exact comparison you need. Click the isolated entry again to restore all series.

This interaction model is now applied consistently across all charts in Dash0: dashboards, explorers, and detail views. No more guessing which legend behavior you will get.

When checks fail, users can now drilldown into underlying telemetry while maintaining context.

Dash0 analyzes the PromQL expression behind the check and extracts the metric names and label filters. Spans, logs, and web events cards display only when relevant synthetic metrics are present, with extracted filters pre-applied.

The system handles complex PromQL queries — including binary operators (+, -, *, /) and logic operators (AND, OR, UNLESS) — by applying applicable filters and skipping those that cannot be reliably mapped.

A practical example demonstrates filtering error spans and logs for a checkout service using a multi-metric PromQL expression. Users can explore the feature on the Failed Checks page and brush time ranges to navigate directly into relevant telemetry.

Contributors: Dejan Miletic, Michele Mancioppi

The Query Builder now uses the same interface as the dashboard panel editor. This means a more consistent experience across Dash0, and as we add new widget types to dashboards, they'll automatically be available in the Query Builder too.

Previously, the Query Builder and the dashboard panel editor were starting to feel like two different products — different layouts, different behaviors, different quirks. This redesign unifies the two interfaces, addressing those inconsistencies.

Dash0 has implemented support for the fill modifier in PromQL binary operations.

The problem being addressed: when performing binary operations in PromQL, results silently disappear when one side lacks matching time series. For example, dividing requests by capacity fails to display instances that haven't yet reported capacity data — creating gaps in dashboards and blind spots in alerting systems.

The solution introduces the fill modifier with three variants:

  • fill(<value>) — applies a default value to whichever side is missing
  • fill_left(<value>) — substitutes only when the left operand has no match
  • fill_right(<value>) — substitutes only when the right operand has no match

Important caveat: When both sides of an operator lack data, no time series is generated.

The feature is now available through Dash0's UI and API. The implementation resulted from collaboration with the Prometheus community.

Dash0 has introduced an opt-in feature enabling automatic conversion of span events into correlated log records during data ingestion. This addresses OpenTelemetry's deprecation of span events in favor of log records linked with trace context.

Background: OpenTelemetry has deprecated span events now that logs have become a stable, fully-implemented signal across SDKs.

How it works:

  • Admins can enable this setting per-dataset in the Dataset settings page
  • No instrumentation changes required — Dash0 automatically "fixes your telemetry" during ingestion
  • Converted log records retain proper trace context
  • A dash0.span_event.converted = true attribute tags converted records

Pricing impact: No change to overall costs. Span events and log records have always been priced equivalently — the bill simply shifts from "Spans and span events" to "Logs" based on conversion volume.

UI adjustments: The "Span events" column in the Tracing view is hidden when conversion is enabled, but can be restored via custom views.

Migration support: Dash0 published agent skills on GitHub to assist users who want to update their instrumentation directly rather than rely on automatic conversion.

When you open any log record and access the Related Logs tab, the system automatically queries a ±30-minute window centered on the active log and displays the results in a scrollable timeline.

The active log appears pinned in the center with a THIS LOG badge and highlighted background. Surrounding entries show relative time offsets (like -2m 15s or +50s) so you can understand temporal relationships. The interface supports infinite scrolling in both directions without closing the panel.

Correlation Modes

Two independent, combinable correlation approaches let you investigate context from different angles:

  • Resource correlation: Identifies all logs from the same service or infrastructure component, creating a local timeline of that resource's activity.
  • Trace correlation: Locates logs sharing an identical trace ID, enabling you to follow a single request across service boundaries.

You can toggle each mode independently via checkboxes, and correlation badges on log entries clarify why specific records appear.

Dash0 now supports exporting audit logs to external systems using the OpenTelemetry Protocol (OTLP). Stream organization-level audit events, including user actions, configuration changes, and access activity, to any OTLP-compatible backend, SIEM, or long-term storage system. Built on OpenTelemetry standards, this capability integrates natively with your existing observability and compliance tooling, giving security and platform teams full control over where audit data lives and how long it is retained.

How it Works

Audit log export is configured in Organization Settings > Integrations. Once enabled, Dash0 continuously streams audit events as structured OpenTelemetry logs to any OTLP-compatible endpoint you specify. Each audit log entry includes attributes such as the acting user, the action performed, the affected resource, and a timestamp.

This means you can route audit logs into any system that speaks OTLP: a self-hosted OpenTelemetry Collector for further processing, a compliance-focused long-term storage backend, or simply back into Dash0 itself for correlation with your operational telemetry.

Why OTLP?

Rather than building a proprietary webhook or CSV export, we chose OTLP as the export format. This keeps audit data compatible with the same pipelines and tooling you already use for traces, metrics, and logs. No custom parsers, no format translations, no additional agents required. If your infrastructure already ingests OTLP, audit logs slot right in.

Last Checked
4h ago
Latest
Jun 1, 2026
Tracking since Jan 27, 2026