---
name: Dash0 Changelog
slug: dash0-changelog
type: scrape
source_url: https://www.dash0.com/changelog
organization: Dash0
organization_slug: dash0
total_releases: 10
latest_date: 2026-04-22
last_updated: 2026-05-01
tracking_since: 2026-03-30
canonical: https://releases.sh/dash0/dash0-changelog
organization_url: https://releases.sh/dash0
---
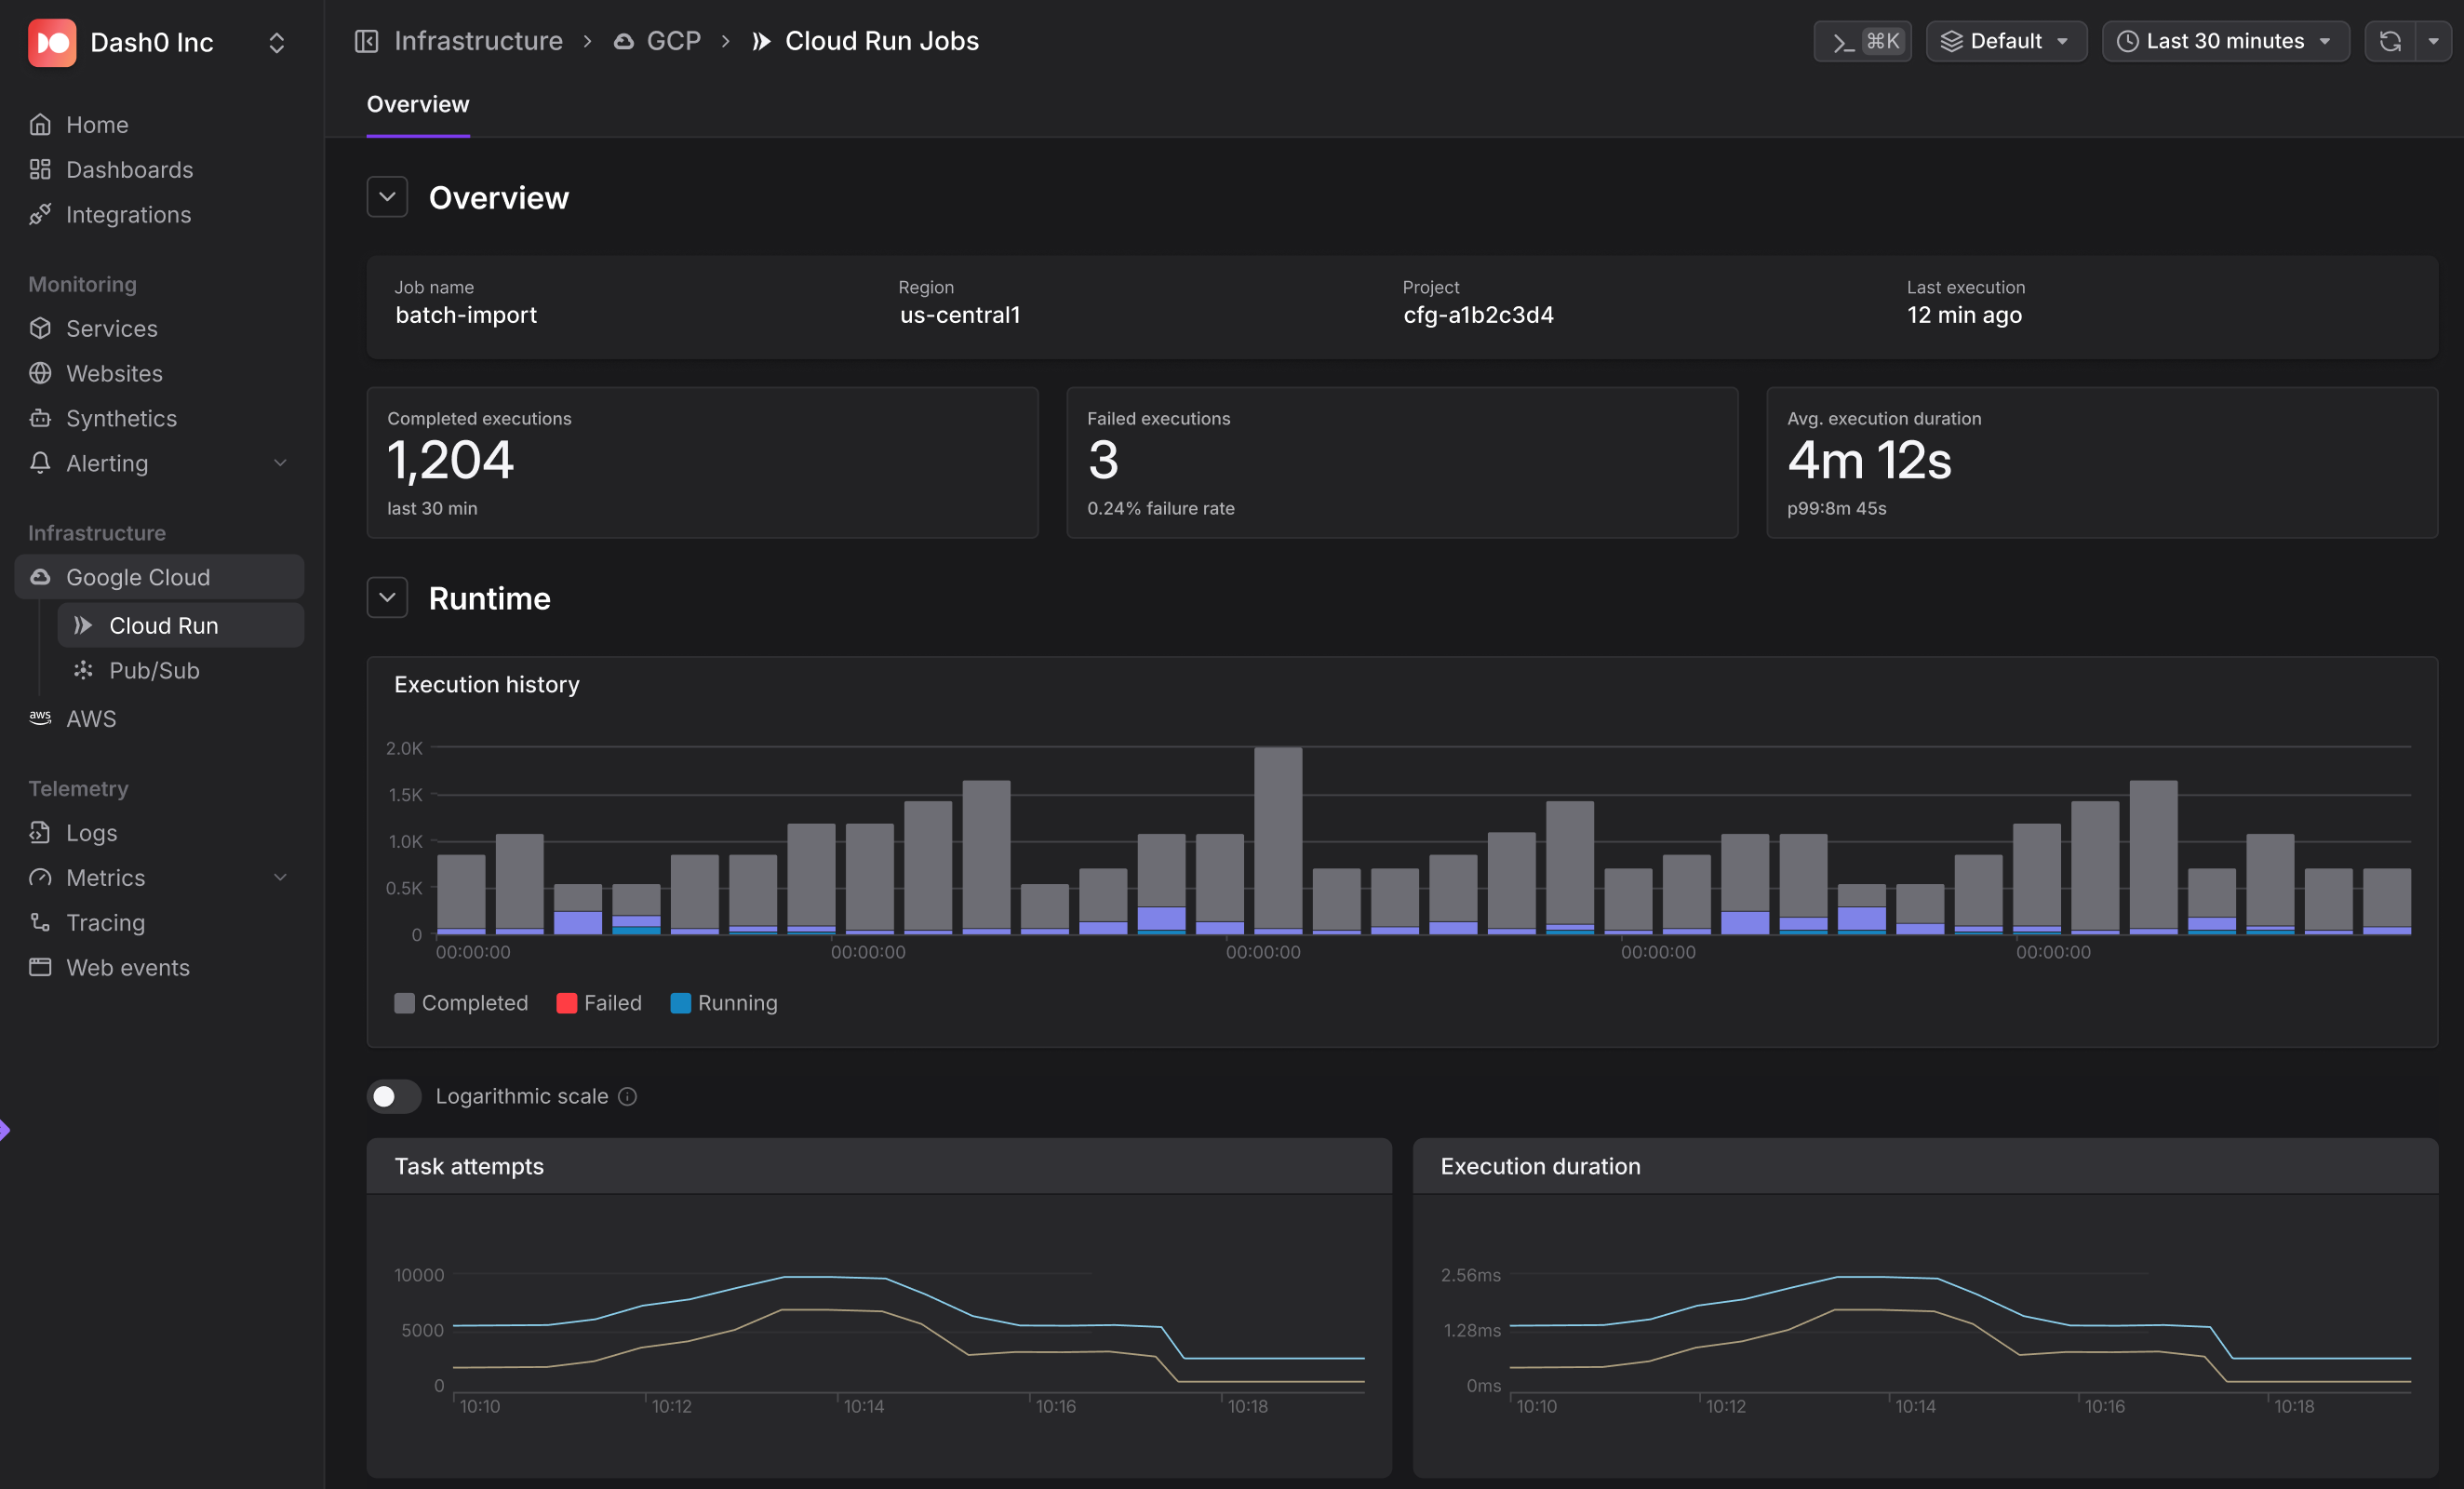
## Google Cloud infrastructure monitoring — Now in Early Access
Google Cloud infrastructure monitoring is now in Dash0. Cloud Run, Pub/Sub, and Cloud Storage metrics flow the moment you connect a project — no setup required.
**Zero-configuration metric collection:** Connect a GCP project through a guided OAuth flow and Dash0 immediately starts collecting a default metric set across every discovered resource.
**Cloud Run monitoring**: Instant visibility into Cloud Run Services and Cloud Run Jobs. Track request counts, latency, error rates, CPU, memory, and instance counts.
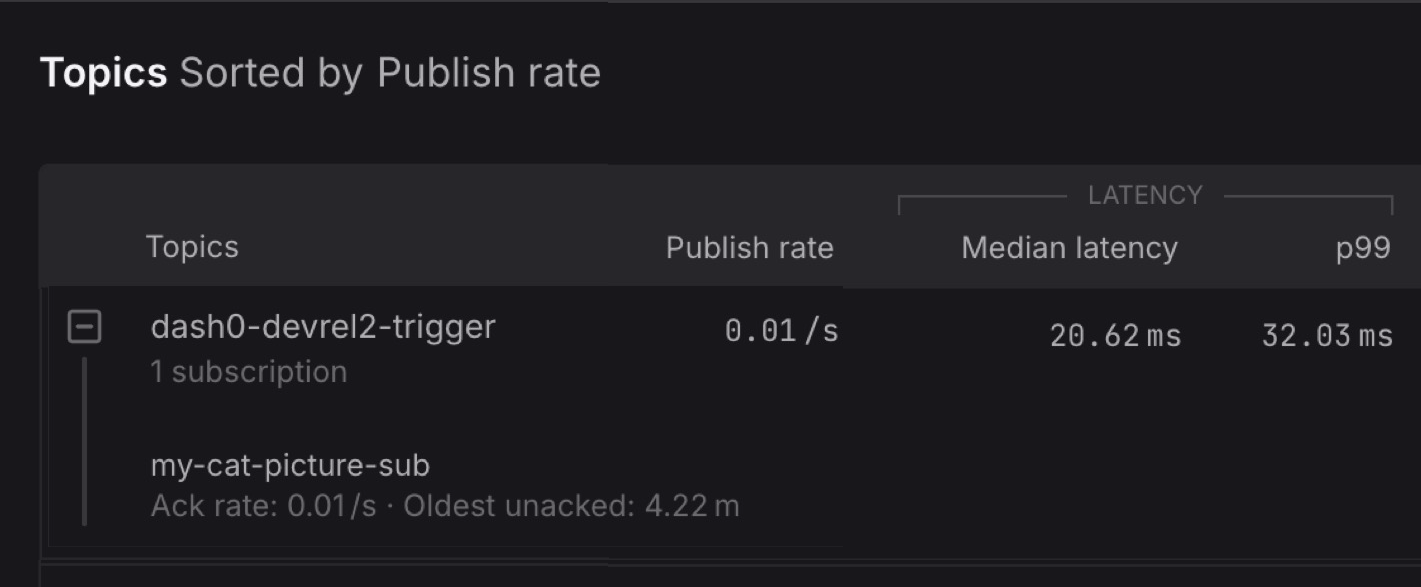
**Pub/Sub monitoring**: Topics and subscriptions in a clean nested view. Catch message throughput issues, delivery latency spikes, undelivered message counts, and oldest unacked message age.
**Cloud Storage monitoring**: Request counts, data transfer volumes, and error rates at the bucket level.
**Metric coverage**: Each service ships with Core, Default, and Extended metrics tiers. Available in early access: Google Cloud Run Services, Google Cloud Run Jobs, Pub/Sub, Cloud Storage.
## Notification channel support in Infrastructure as Code
Notification channels and routing rules can now be managed as Infrastructure as Code in Dash0. Supports Slack, PagerDuty, email, webhooks, and 17 total integrations.
**Dash0 CLI** (since v1.9.0): `dash0 -X notification-channels create/list/get/update/delete`
**Terraform provider** (since v1.8.0): `dash0_notification_channel` resource with `notification_channel_yaml` field.
**Kubernetes operator** (since v0.136.0): `Dash0NotificationChannel` CRD that syncs channels to Dash0 and reports status back on the custom resource.
Channels are organization-level resources and can be version-controlled, reviewed in PRs, and replicated across organizations via CI/CD or GitOps workflows.
## New SQL Query Language
Dash0 SQL is now generally available. Write queries directly against your logs, spans, and web events.
**Full SQL Support**: Joins, subqueries, aggregations, and functions for aggregation, string manipulation, date, array, math, logic, JSON extraction, and type conversion. Compatible with AI tools for query generation.
**Built-in Query Templates**: A library of ready-to-run query examples to start from.
**Recent Queries**: Local history of your last 20 queries.
**Saved Views with Sharing**: Save named views that persist across sessions and devices, shareable with teammates.
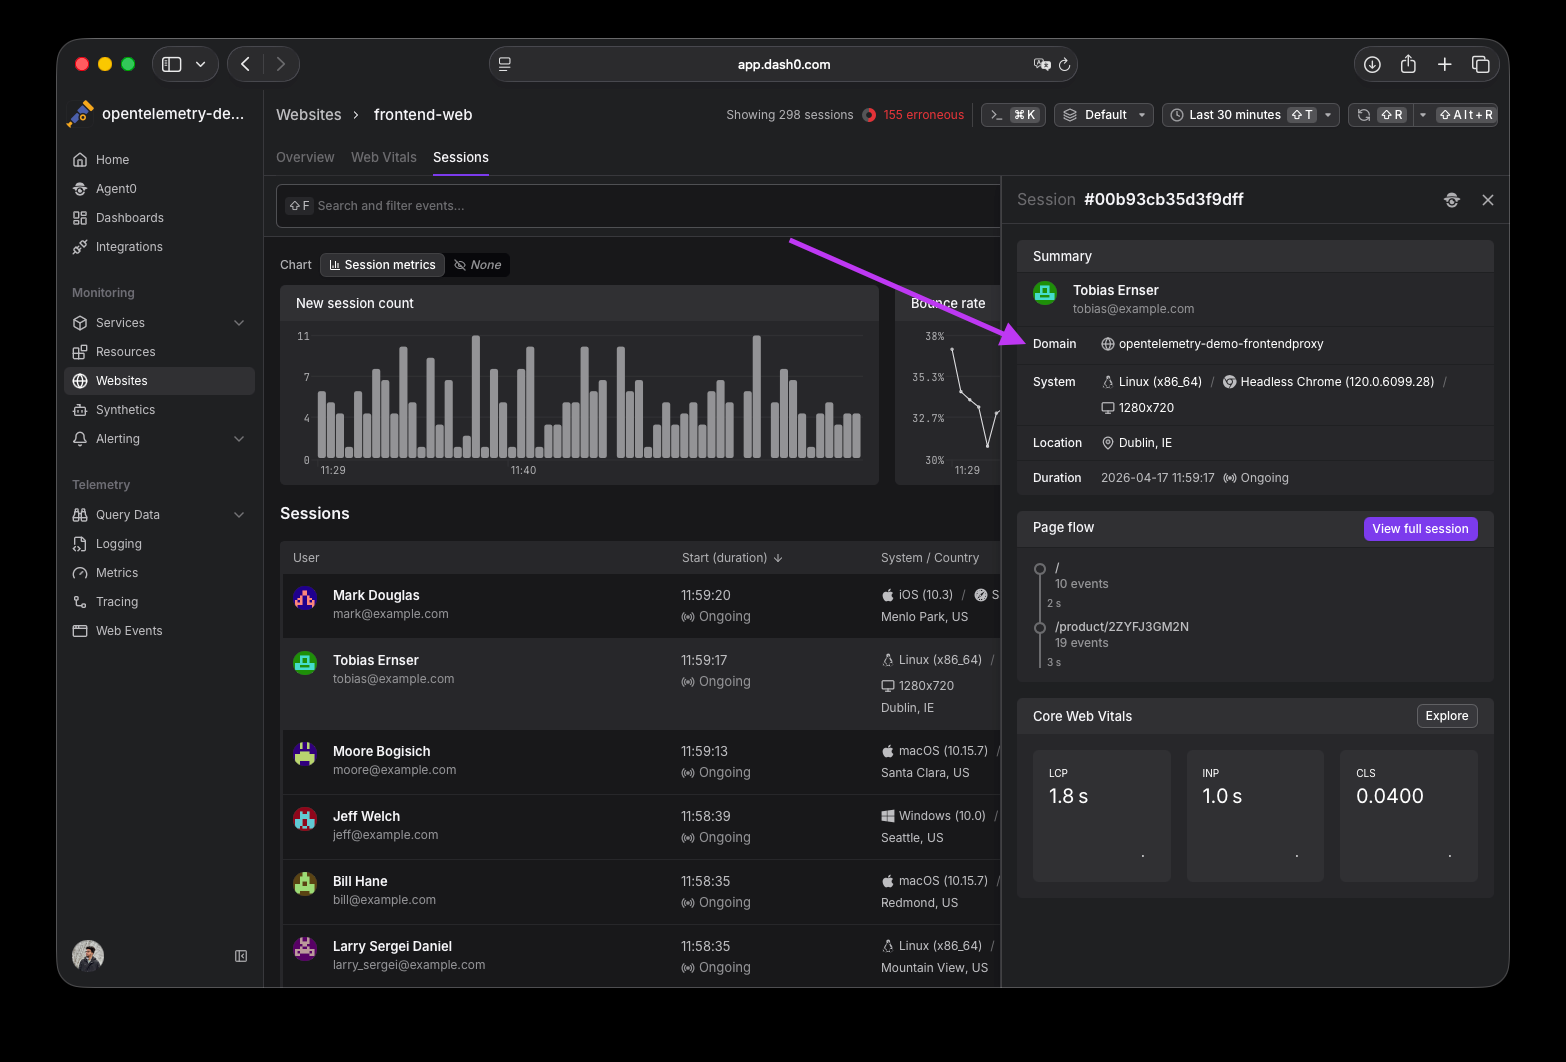
## Domain visibility for multi-site setups
The `page.url.domain` attribute is now surfaced in three places for multi-site web integrations:
- **Session list sidebar**: Domain shown alongside location and browser info.
- **Session detail page**: Domain appears in the header for quick context.
- **Dashboard filters**: New Domain filter variable available in Overview and Web Vitals dashboards.
Also: session detail header items now wrap gracefully on smaller screens instead of getting squeezed.


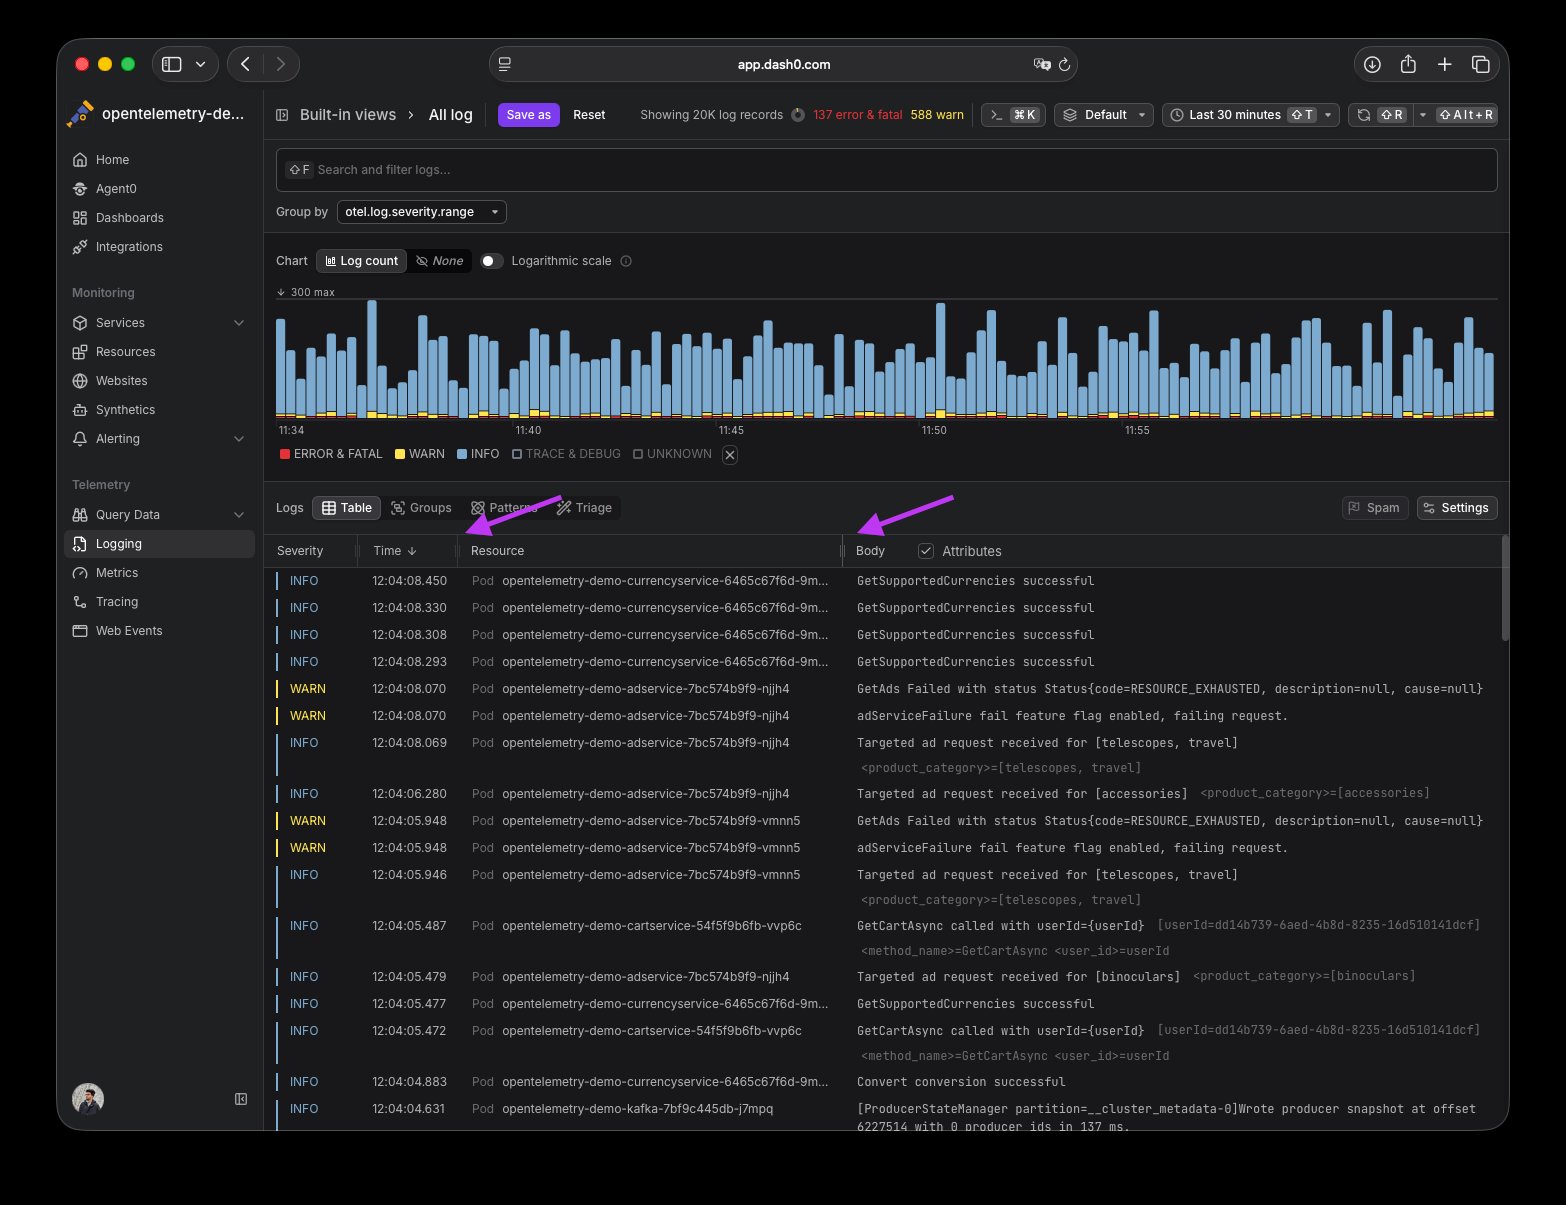
## Resizable table columns
Drag-to-resize handles have been added to table columns across Dash0's explorers (Trace Explorer, Log Explorer, Web Events Explorer, and Resources). Hover over the table header row to reveal grip handles at column edges, then drag to adjust width. Save your view to persist column sizes across sessions. Use the view reset button or the "Reset column sizes" option in the table Settings menu to revert.
## OAuth Authentication for MCP
Dash0's MCP server now supports OAuth 2.0 authentication. Tools like Claude Code, Cursor, Windsurf, and other MCP-compatible clients can authenticate without managing static API tokens.
**How it works**: When you add Dash0 as an MCP server, the tool opens a browser for login and consent. Dash0 handles dynamic client registration, token exchange, and automatic refresh.
**Key benefits**:
- No token management required
- Short-lived tokens (15-minute expiry) with automatic refresh
- Full audit trail of OAuth authorizations, token exchanges, and revocations
- Revocable at any time via User Settings → Applications
Once connected, AI tools have access to 20+ MCP tools for querying observability data — service catalogs, PromQL metrics, logs, traces, synthetic checks, dashboards, and more.
Bearer token authentication remains fully supported alongside OAuth.
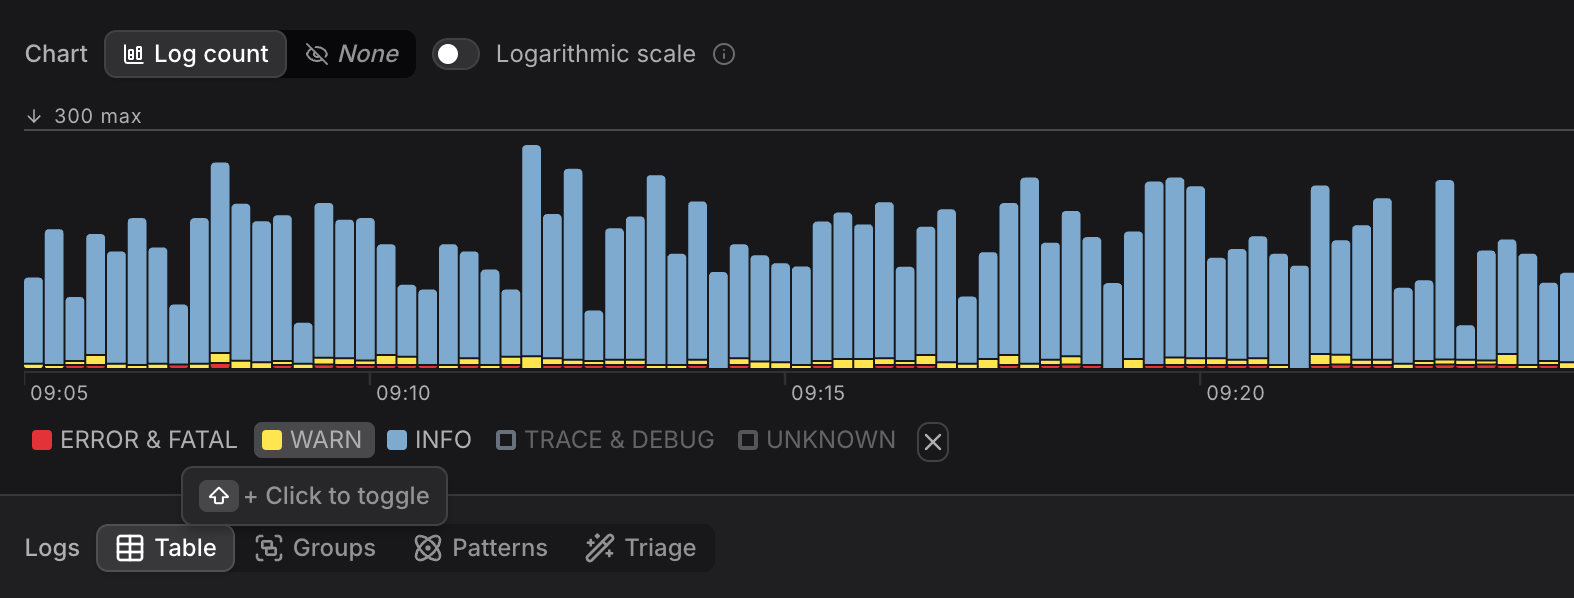
## Consistent Chart Legend Behavior
Chart legends now behave consistently everywhere in Dash0.
- **Click** a legend entry to isolate that series (all others hidden).
- **Shift+click** to select multiple series for comparison.
- Click the isolated entry again to restore all series.
Applied consistently across all charts: dashboards, explorers, and detail views.
## Improved Failed Checks Drilldown
Dash0 now provides a seamless drilldown experience from failed checks directly into relevant spans, logs, web events, and metrics — with filters automatically extracted from the check's PromQL expression.
**How it works**: When you open a failed check's details view, Dash0 analyzes the PromQL expression, extracts metric names and label filters, and pre-applies them to drilldown cards:
- Spans, Logs, and Web Events cards appear when the check uses a related synthetic metric (e.g., `dash0.spans` or `dash0.spans.duration`), with extracted filters pre-applied.
- Metrics cards list all other metrics used in the check, filtered to relevant label matchers.
Brush a time range in the timeline chart to jump directly into relevant telemetry. Supports complex PromQL with binary operators, logic operators, and more.
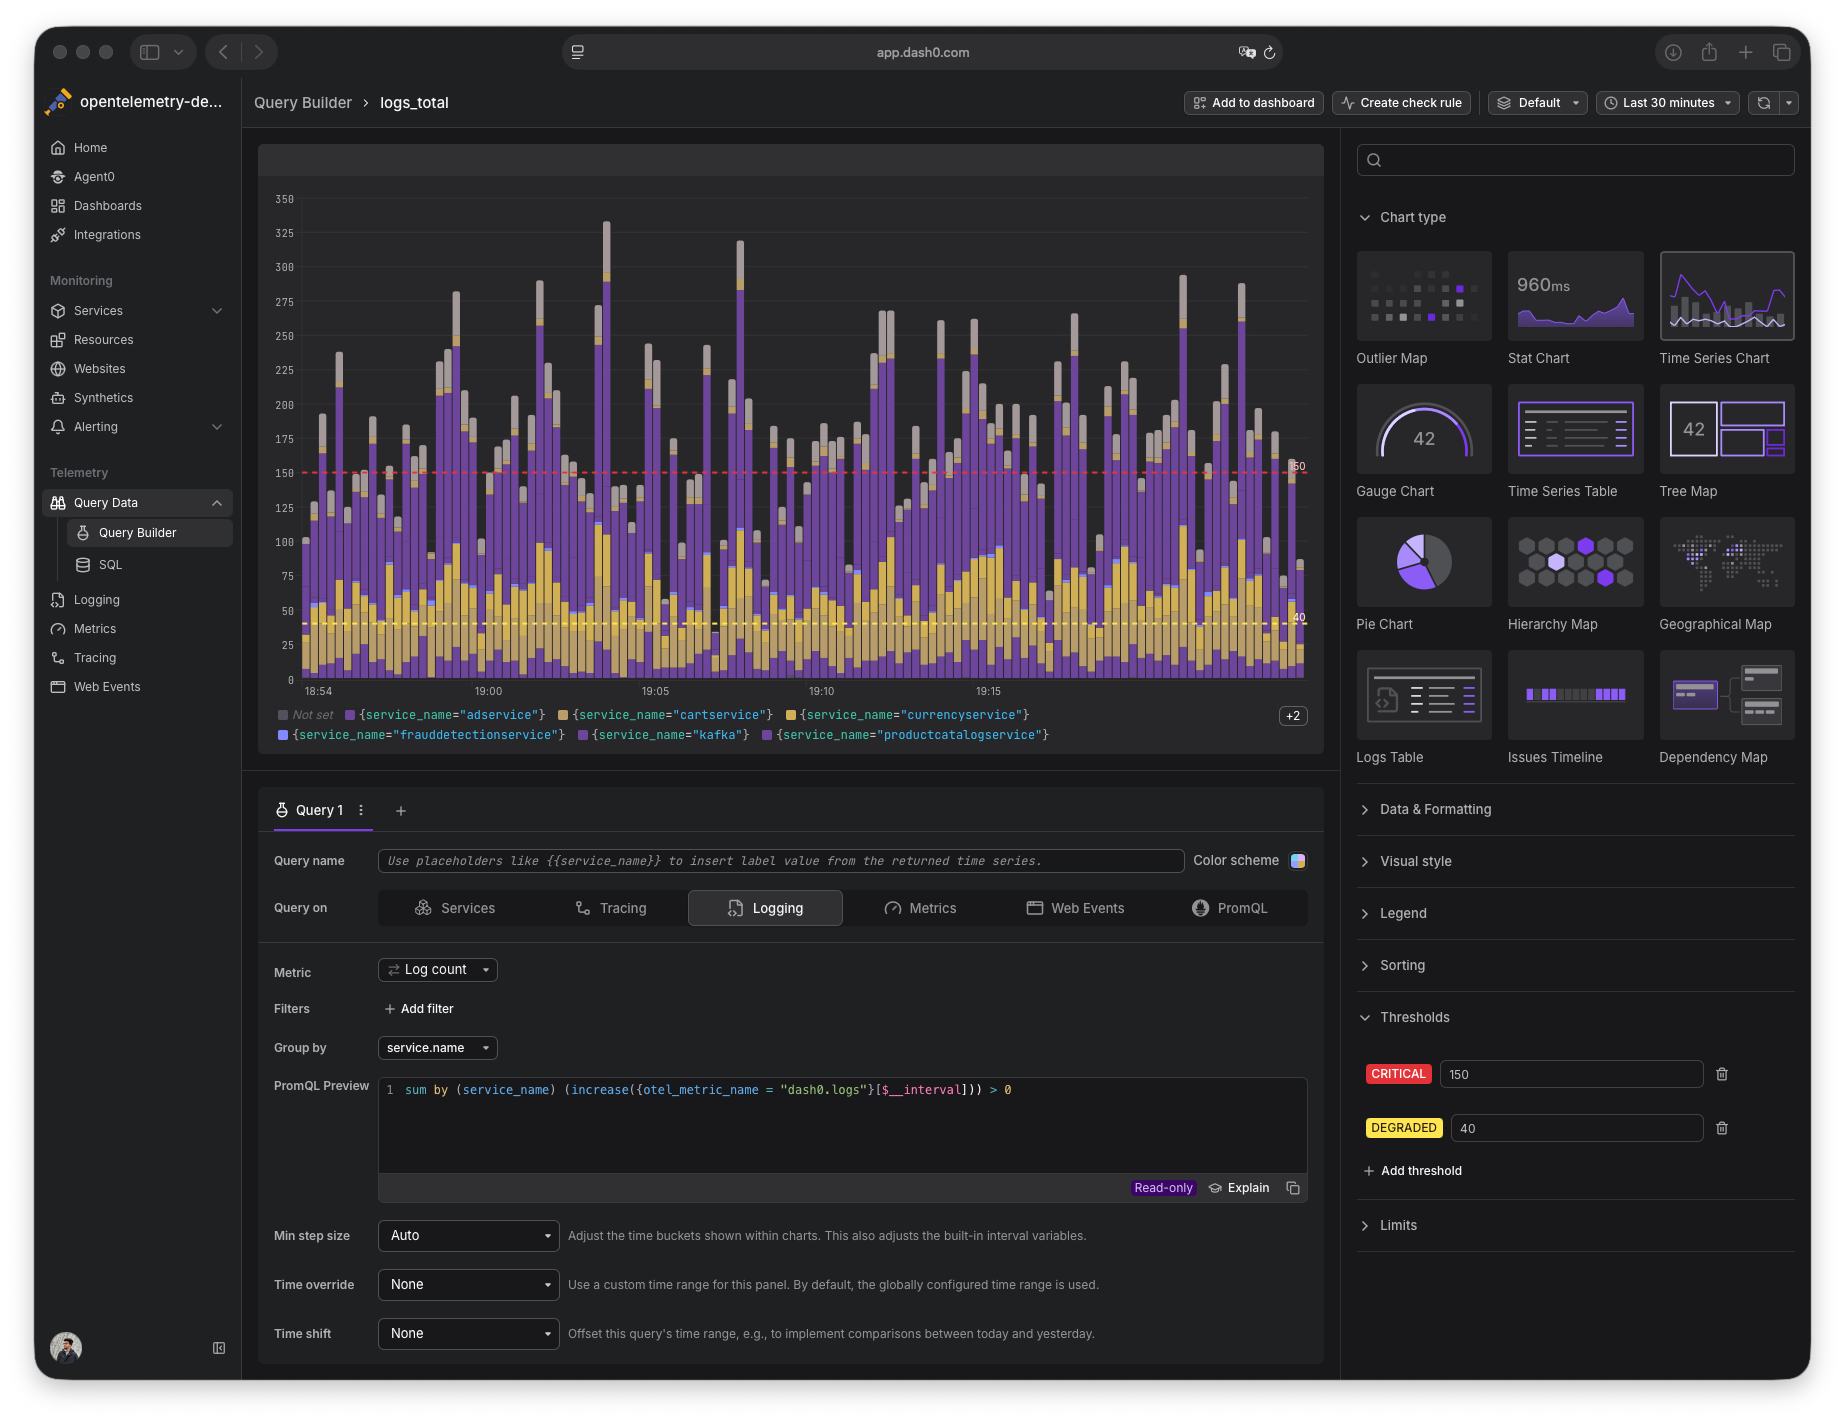
## Redesigned Query Builder
The Query Builder has been unified with the dashboard panel editor, providing a cleaner, more consistent experience across Dash0. New widget types added to dashboards will automatically be available in the Query Builder as well.
## Fill operator support in PromQL
Dash0 now supports the `fill` modifier for binary operations in PromQL, giving explicit control over what happens when one side of an expression has no match.
**Three variants**:
- `fill()` — applies default to whichever side is missing
- `fill_left()` — substitutes only when the left-hand side has no match
- `fill_right()` — substitutes only when the right-hand side has no match
Note: when *both* sides of an operator are missing, no time series is generated.
Dash0 worked with the Prometheus community to develop this feature. The `fill` operator is now available via the UI and API in Dash0.