Web events as chart annotations
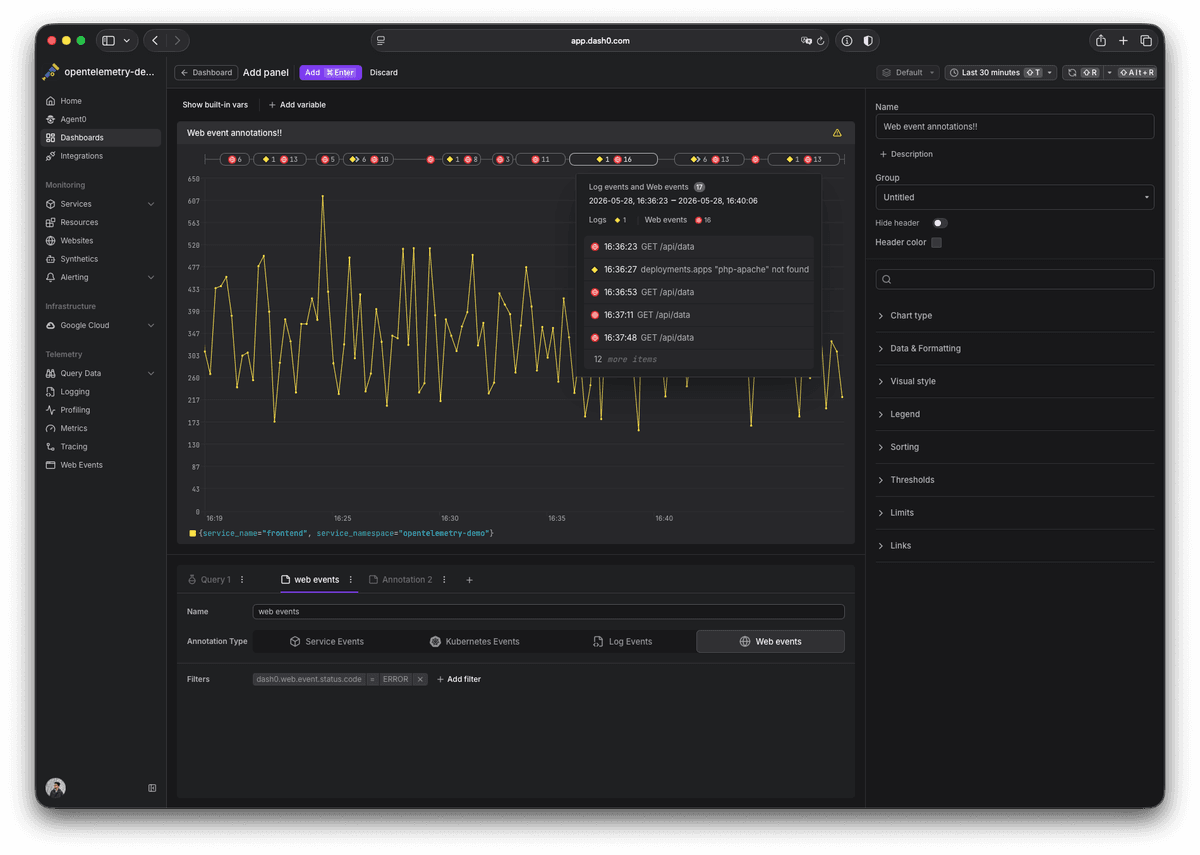
Dash0 now supports web event annotations on time-series charts, letting you correlate spikes and dips in your time-series charts with what real users were doing.
Real User Monitoring (RUM) web events can be overlaid on time-series dashboard widgets alongside existing annotation sources such as logs, Kubernetes events, and service events.
Features:
- Apply filters consistent with the Web Events Explorer interface
- View matching events as markers on chart timelines
- Clustered markers collapse into grouped pills by event type, maintaining visual distinction between event categories
- Chart legends include a dedicated "Web events" row with separate event counts
- Each marker displays a tooltip with event attributes and provides one-click navigation to the Web Events Explorer with filters and selections preserved, enabling rapid navigation from dashboard observations to detailed session analysis
Fetched June 3, 2026