Application Metrics are now GA
Sentry's Application Metrics are now GA.
If you missed the beta: Application Metrics let you track the signals that matter in your application — checkout completion rate, job queue depth, auth failure rate — using counters, gauges, and distributions using the Sentry SDK.
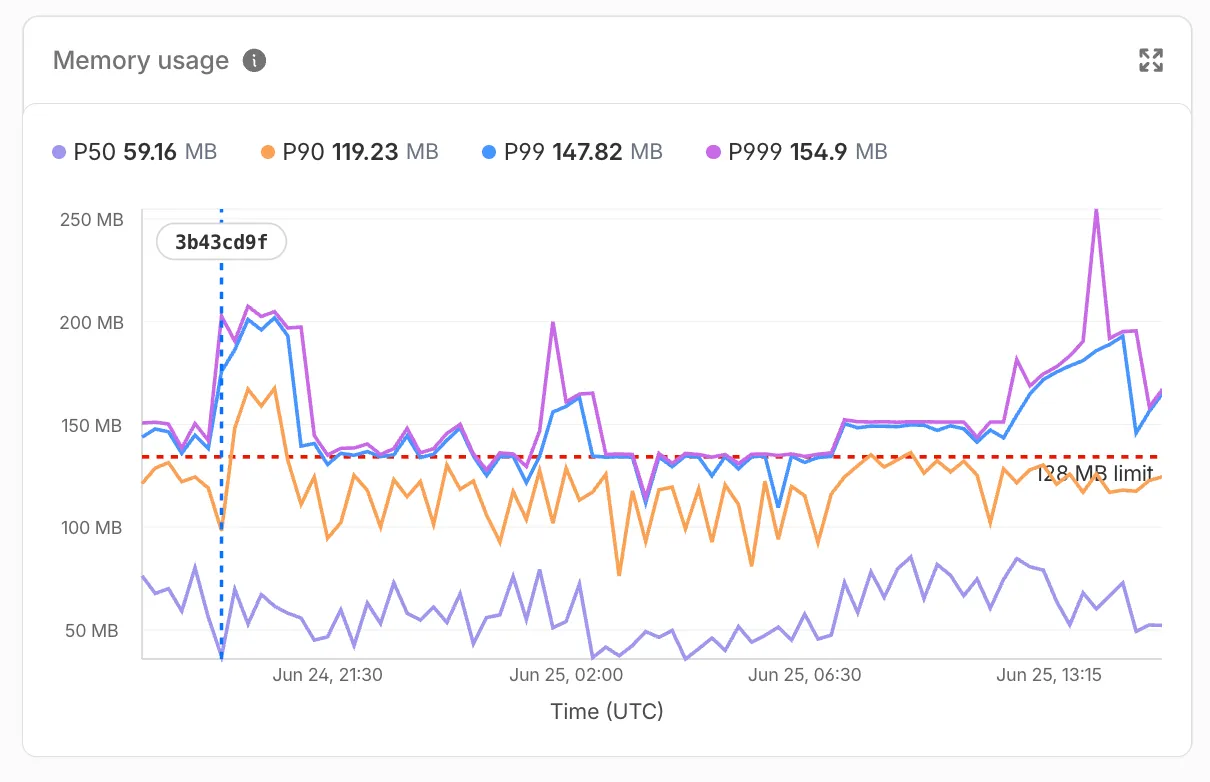
What makes Sentry's metrics different: they're high-cardinality and trace-connected. Tag a metric with user ID, region, plan type, or any attribute you care about, and slice by any of them at query time so you can ask questions about your application or users. When something spikes, you get the connected trace, log, or error to find out why.
We've also added several new features leading up to this launch:
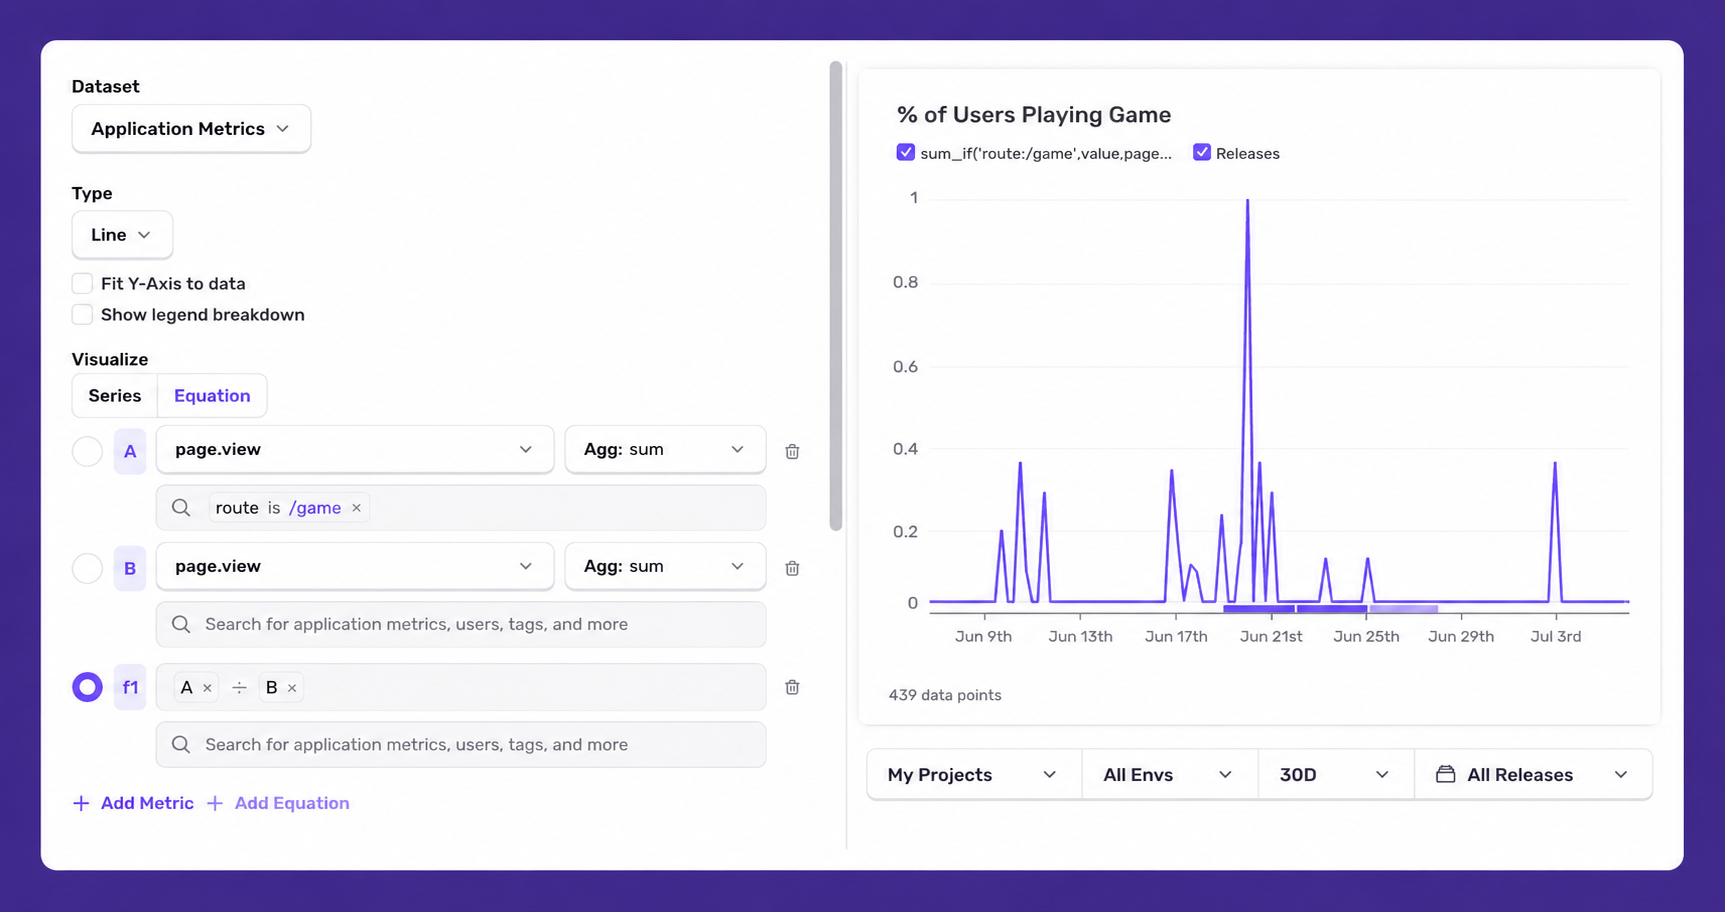
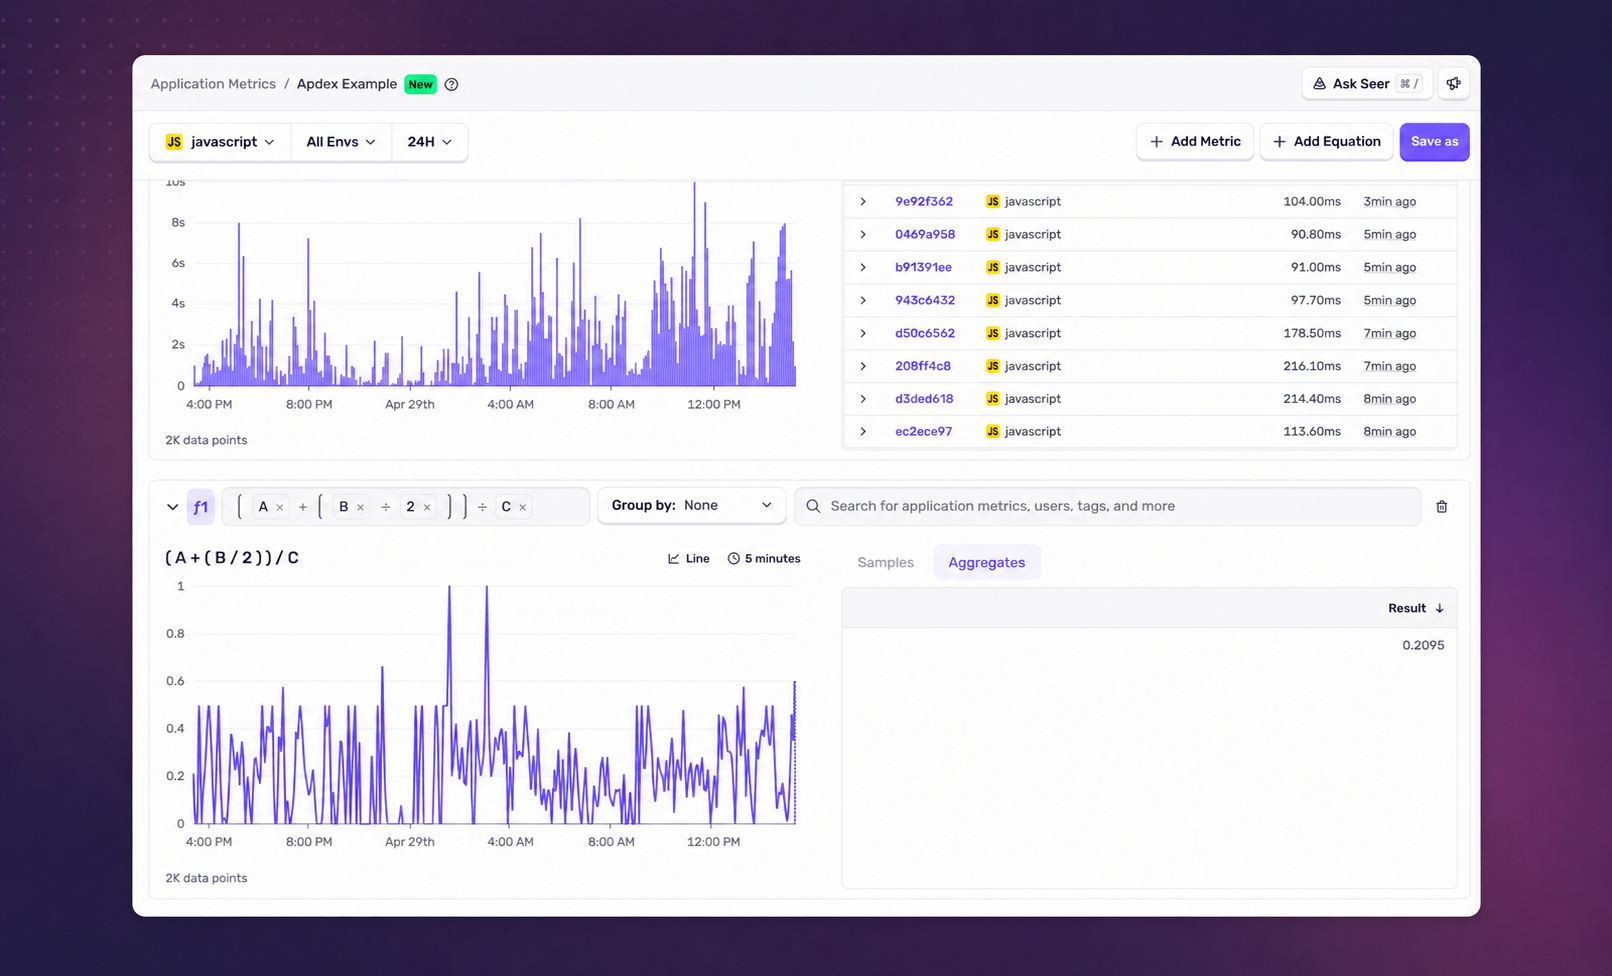
- Equations: Perform arithmetic across multiple metric series. Compute things like failure rate or Apdex directly in the explorer.
- Cross Event Querying: find exemplar traces for a specific metric value. Useful when you want to see the exact request behind a data point.
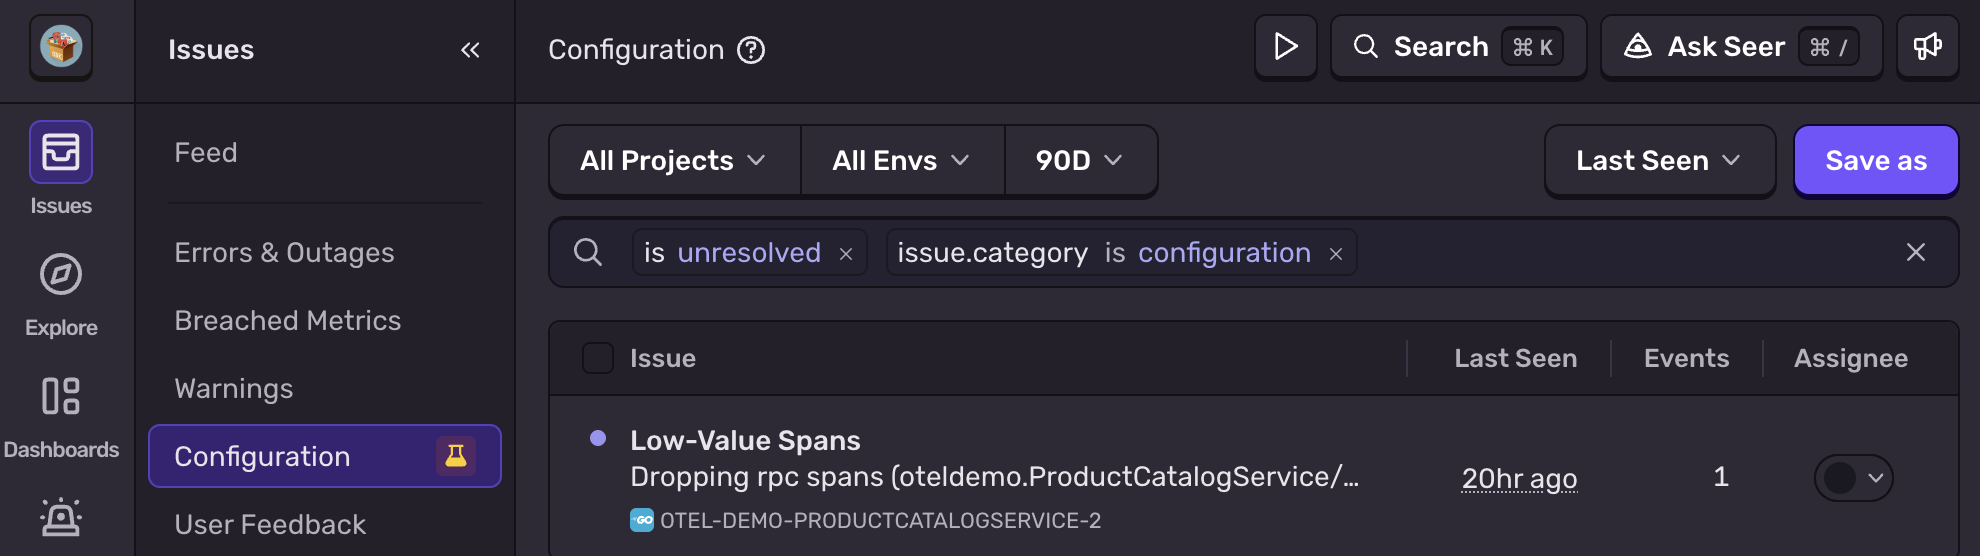
- Alerts: Create a monitor on any metric and get notified when it breaches a threshold. When it fires, the traces, logs, and errors are already connected.
5 GB of Application Metrics is included on all Sentry plans, beyond this they're priced the same as logs at $0.50/GB. Get started by going to Explore > Metrics or checkout the with the docs, and Join the conversation on GitHub.
Fetched May 6, 2026