
How we measure data completeness at scale
When a customer gets paged at 3 a.m., they expect the graphs in Datadog to show the full picture of the data they sent. When an AI agent, such as one making autoscaling or remediation decisions, acts, it relies on the same assumption.
At Datadog's scale, billions of payloads per second flow through hundreds of distributed pipelines. Even a small hiccup raises hard questions: Did the data stall? Where? And did it impact customers?
Those payloads power everything from ad hoc queries to push-based products like Monitors. As more workflows are automated using AI agents, the stakes get higher: Downstream systems act on whatever data they receive. Incomplete data doesn't just affect a dashboard. It affects real decisions. But those decisions are only as good as the data behind them. To trust the data, we need a way to verify its completeness in real time for every customer.
The Data Completeness team at Datadog is responsible for measuring completeness across all ingestion pipelines. This system has to answer that question for every product and every customer. In this post, we explain how we built our data completeness system to track payloads end to end across our ingestion pipelines.
Define what complete data means at Datadog scale
What does complete mean in Datadog's ingestion pipelines?
For us, completeness means that every payload entering Datadog is available to our customers, whether they're using our AI agents, looking at dashboards, or receiving an alert at 3 a.m. In this context, a payload can be a metric datapoint, a log, a span, or any other type of telemetry data ingested into Datadog.
Answering "Is the data complete right now?" is harder than it sounds. Our ingestion stack spans hundreds of services and many possible paths between them. More importantly, we need to answer this question per customer, not globally. Each customer's data can follow a different path depending on partitioning, isolation strategies, or traffic patterns. At scale, this creates a combinatorial explosion in the number of possible paths we need to reason about.
Metrics pipelines span hundreds of distinct paths in a single region. Products like Application Performance Monitoring (APM), which also feed data into the metrics pipeline, add their own tens of paths.
We needed a system that could track data end to end across Datadog's ingestion pipelines without depending on the intake and processing services it observes. This system had to answer "Is the data complete?" and explain where and why it is not when systems degrade.
Just as importantly, the system needed to support the engineers operating these ingestion pipelines by providing accurate diagnostics to identify which parts of the system are unhealthy so that both humans and automated systems can react in seconds.
Track data completeness one segment at a time
Before landing on this approach, we considered watermark-based tracking, similar to what streaming frameworks like Flink use. The idea is appealing: Advance a watermark as data arrives and declare completeness once it passes a threshold.
But watermarks rely on data arriving within a predictable window. At Datadog, customers can send arbitrarily delayed data, making it impossible to advance a watermark. Our ingestion pipelines also involve loops, traffic replay, and other edge cases that make any watermark-based approach too unreliable for the guarantees we needed. So we went back to first principles.
To track payloads across distributed ingestion pipelines, we started with a simple idea: Split pipelines into segments and track each payload as it moves through them. We can then combine those segment-level measurements to compute the overall completeness of a pipeline.
In practice, a pipeline is composed of multiple services connected by queues (for instance, intake to Kafka to processing to Kafka to router). We define a segment for each step in that flow, both within a service and between services. For example, intake-in to intake-out is one segment, and intake-out to processing-in is another. This lets us reason about completeness locally at each step, rather than trying to observe the entire pipeline at once.
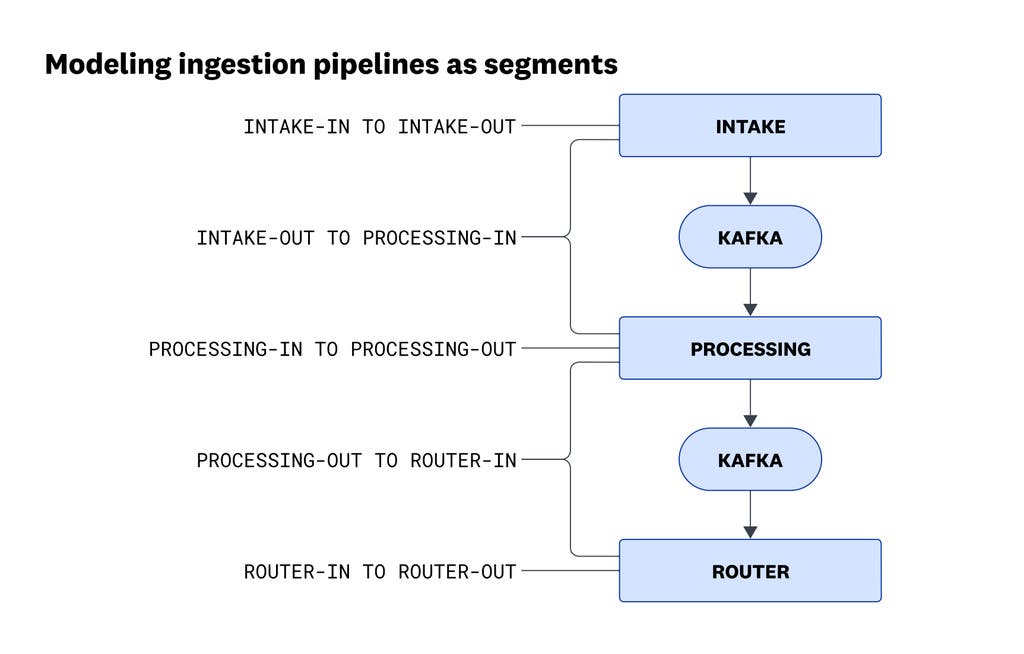
We model the ingestion pipeline as a sequence of segments inside and between services (for example, intake-in to intake-out or processing-in to processing-out), allowing us to measure completeness at each step and combine those measurements into an end-to-end view.
Count payloads by using creates and acknowledgments
Once we defined pipeline segments, tracking payloads became possible: How many payloads entered a segment, and how many exited it? If both counts are equal, we haven't lost any. To make this reliable—even when payload submissions are retried—we assign a unique identifier to each payload.
When a payload enters a segment, we record a create operation in our completeness system. When the payload exits, we record an acknowledgment for that same identifier. By comparing these two counts, we can determine the completeness of each segment.
Because distributed systems can retry or reorder events, these counts need to be idempotent. We achieve this with a time-bucket model. Completeness is always scoped to a bucket indexed by when the payload first entered Datadog, using a timestamp we control rather than relying on customer-side clocks.
Within each bucket, every unique identifier is tracked with its current state per segment: created, acknowledged, or acknowledged before the create identifier was received, which is a valid edge case in distributed systems. When a duplicate create or acknowledgment arrives for the same identifier in the same bucket, the system recognizes it from the existing state and ignores it. The time-bucket model makes the count inherently idempotent without coordination overhead.
The following diagram shows how create and acknowledgment events flow through the system and are aggregated per segment.
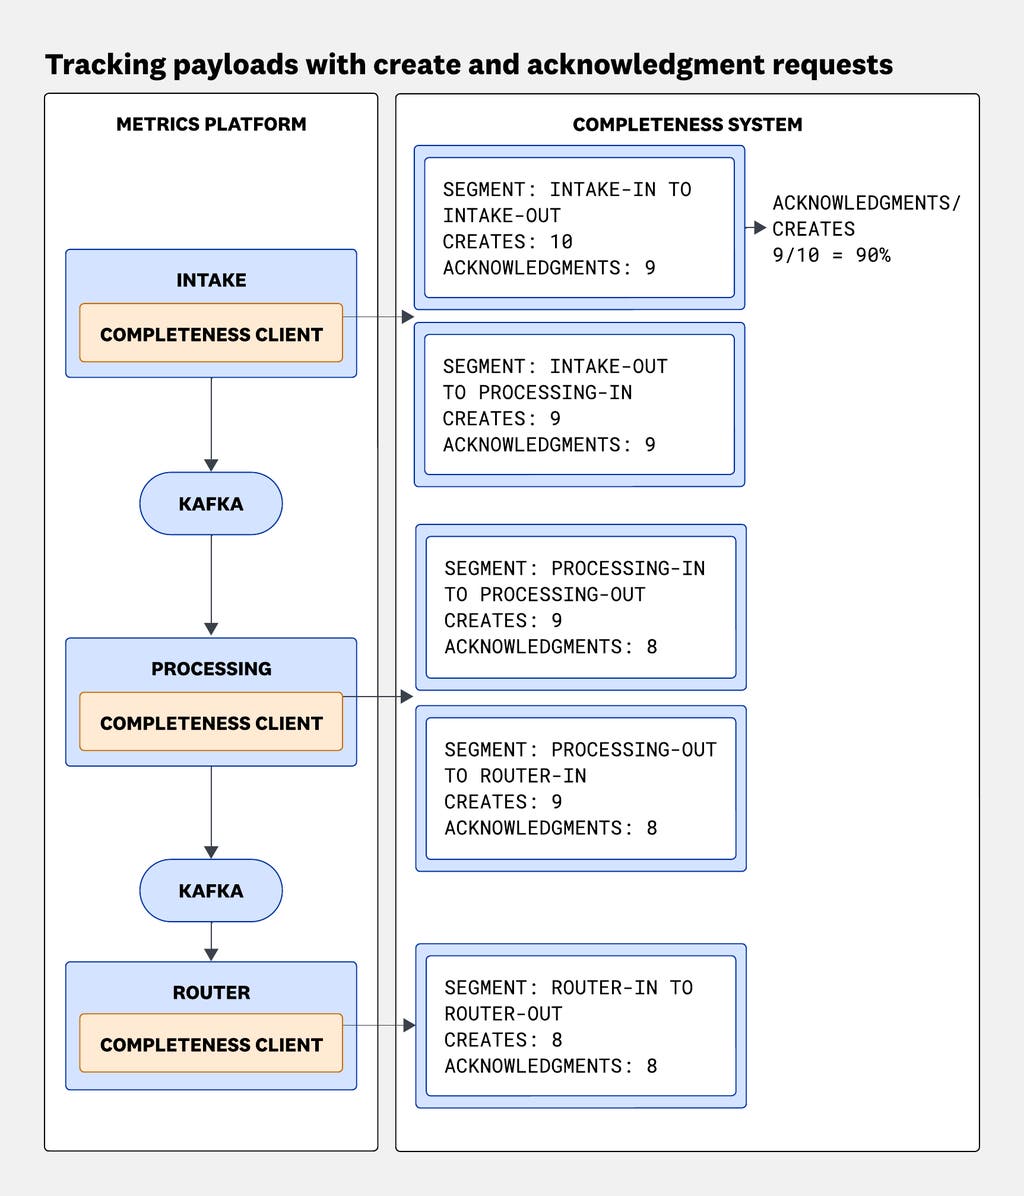
Each segment reports create and acknowledgment counts to the completeness system, which computes completeness as the ratio of acknowledgments to creates within a time bucket (for example, 9/10 = 90%).
Compute end-to-end pipeline completeness from segment ratios
Each segment is measured independently by comparing how many payloads enter it with how many exit it. We call this ratio segment completeness.
To compute the completeness of an entire pipeline, we combine segment-level measurements by using mathematical operations. For sequential pipelines, completeness is the product of segment ratios.
For parallel pipelines, it turned out to be more complex. Some pipelines have internal branches. APM trace data, for example, is processed by two independent downstream services: one computing error rates and request counts, another computing latency distributions. If we treat the two branches as a single pipeline, a completeness bucket stays incomplete until the slowest branch has processed all relevant data. This makes already available data appear incomplete.
This forced us to rethink how we aggregate results. We used a weighted average model for parallel branches, where each origin contributes to the overall completeness in proportion to the volume it carries.
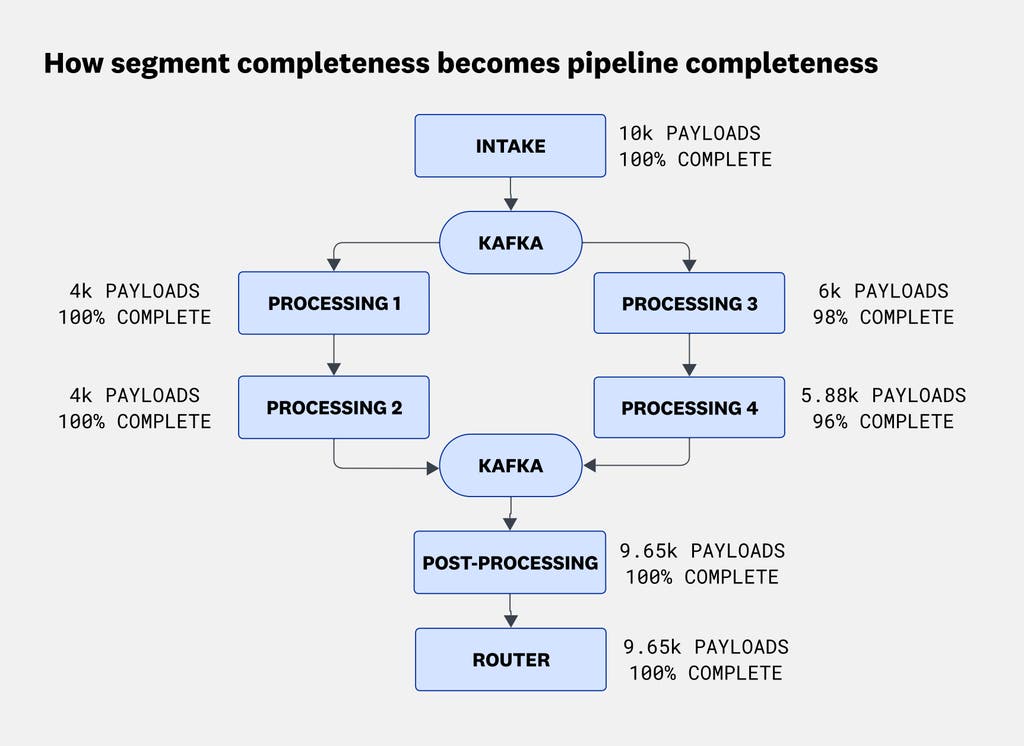
We combine segment-level completeness values to compute end-to-end pipeline completeness across sequential and parallel paths.
For example, in the diagram above, we show a pipeline that processes 10k payloads with two parallel branches:
-
One branch contains two services that process 6k payloads (98% complete) and 5.88k payloads (96% complete), respectively. To compute the overall completeness of this branch, we multiply their completeness ratios: 98% × 96% = 94% complete.
-
The other branch processes all of its payloads, resulting in a 100% completeness ratio.
We compute the combined completeness by weighting each branch by its volume:
This result is then combined with the rest of the pipeline by multiplying sequential segments. In this example, the surrounding segments are all 100%, so the final end-to-end completeness remains 96%.
Design for reliability and cost efficiency at scale
Measuring completeness is only useful if the measurement is trustworthy, especially during an incident, when the stakes are at their highest and the data is most likely to be wrong. This requirement shaped every architectural decision we made.
Designing this system meant balancing competing constraints.
We needed per-customer accuracy without turning the system into a bottleneck. The measurement also had to remain reliable even when the ingestion pipeline itself was degraded. At the same time, we avoided external dependencies, since failures in those systems would undermine the very signal we rely on during incidents.
Understand the completeness system's core architecture
Let's take a closer look at how the system works. It is built around two main services: an intake layer and a storage layer.
The intake receives tracking events and forwards them to storage. The storage layer maintains pipeline completeness state and tracks the unique identifiers of in-flight payloads.
Each ingestion service runs a lightweight client library that sends create and acknowledgment events to the intake. A query service retrieves this data from storage and serves completeness queries.
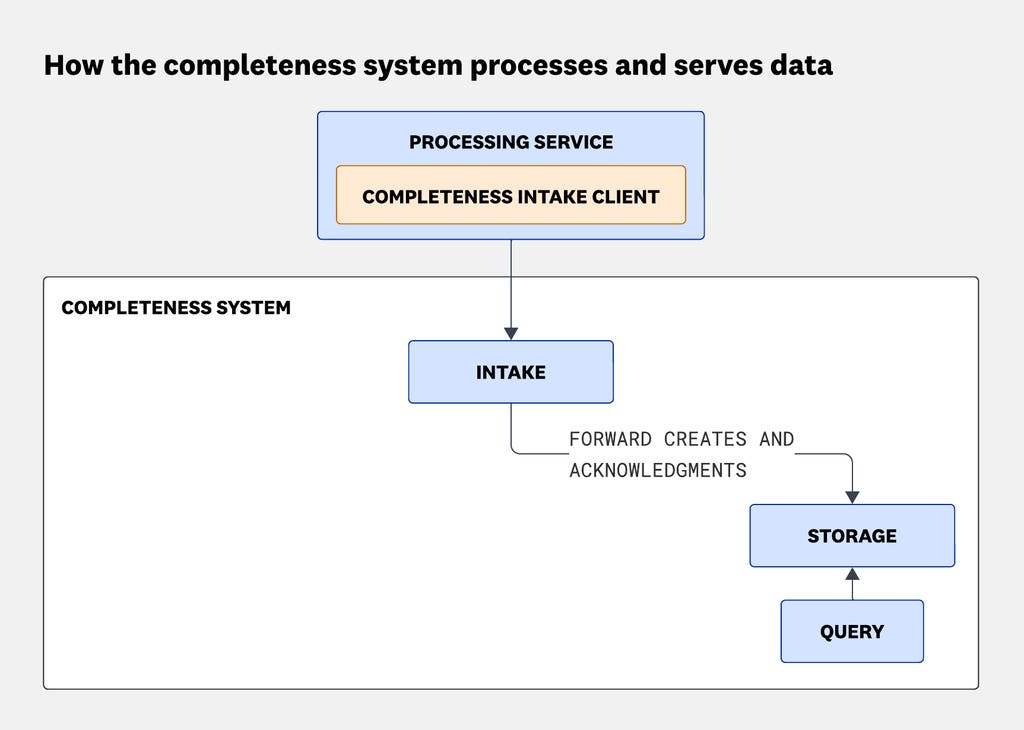
The completeness system collects create and acknowledgment events from ingestion services via an intake layer, forwards them to storage, and serves completeness queries through a query service.
Achieve per-customer accuracy without drowning in cost
Given that each customer's data can follow a different path depending on partitioning, isolation strategies, or traffic patterns, we needed accurate per-customer measurements without overwhelming the system.
You might wonder how we can track every payload entering Datadog for every customer without prohibitive cloud costs. The answer is that we don't.
Instead, we track a subset of payloads per customer and adjust this subset dynamically based on customer traffic. This allows us to maintain accurate measurements while keeping overhead under control.
In each ingestion service, the completeness client makes a load-shedding decision to sample or not whenever a payload enters a segment. If the payload is sampled, a create or acknowledgment event is sent to the completeness system. If not, the client increments a counter representing the weight of unsampled payloads, so they are still accounted for without being tracked individually. The client sends this accumulated weight alongside the next sampled create operation.
To decide which payloads to sample, the client relies on a load-shedding bulletin. This bulletin specifies which segment and customer combinations should be sampled, along with a sampling ratio.
The completeness system computes the bulletin centrally and distributes it to ingestion services, allowing each client to make consistent decisions based on current traffic and system load.
The completeness system generates the bulletin by using a fixed threshold per segment and customer, which bounds overhead while preserving accuracy. In practice, we tune this threshold so that the completeness signal remains actionable without driving up tracking costs.
The system computes load-shedding bulletins in two stages, as shown below.
First, each storage node computes a partial bulletin for the subset of customers and segments it is responsible for. This computation runs over a longer time window, which keeps it stable but prevents it from reacting quickly to sudden traffic spikes. In particular, it cannot account for traffic that never reaches storage because the system is already overloaded.
To address this, the intake layer computes the final bulletin. It combines the storage-generated bulletin with a view of in-flight traffic, allowing it to detect sudden surges and adjust sampling more aggressively. This two-stage design ensures the system can react in real time while still benefiting from the stability of the storage-side computation.
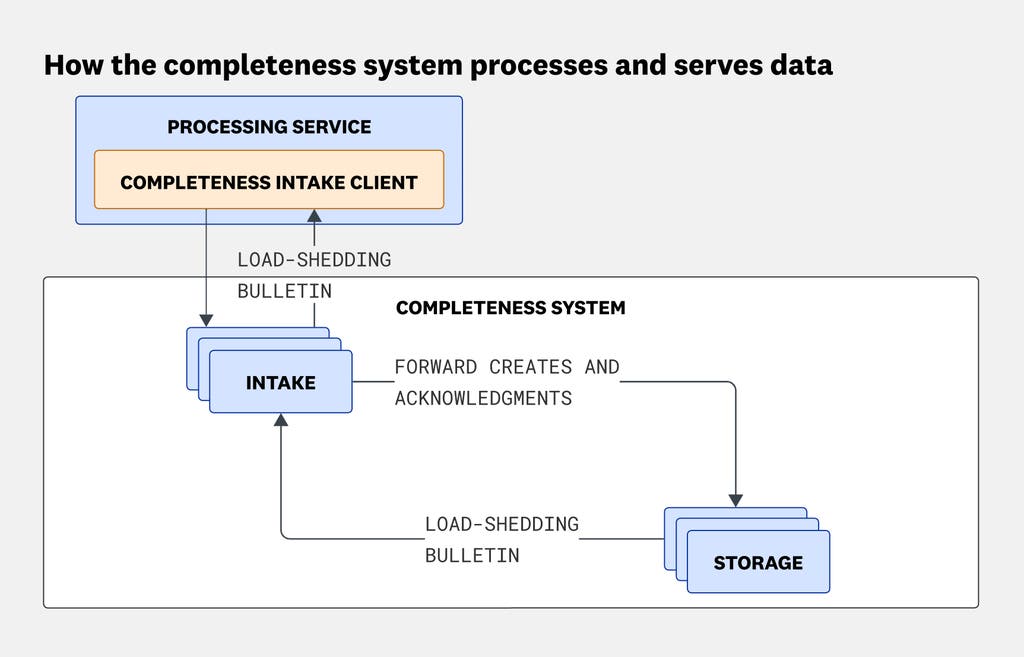
The completeness system computes a load-shedding bulletin based on traffic observed across storage nodes and distributes it to ingestion services via the intake layer. Clients use this bulletin to decide which payloads to sample, while unsampled payloads are accounted for through aggregated weights.
Build a system that outlives the outage
Building a system that outlives the thing it monitors sets an unusually high bar. If our completeness system depends on Kafka, it fails exactly when Kafka fails, which is when we need it most. This led to one foundational decision: minimal external dependencies.
This meant no Kafka, no external database layer, and avoiding dependencies on systems whose failure modes are outside our control. This approach proved effective in practice. During a major Kafka cluster incident, our completeness system continued running while dependent systems degraded around it.
Our deployment model reflects this focus on reliability and blast radius reduction. We implemented what we call tracks, where we partition the products we cover into separate deployments. This ensures that issues in one product's ingestion pipeline do not affect completeness measurements for others.
We also rely on availability zones. We deploy our intake and storage layers independently across two availability zones, running two copies of the system in parallel so each zone can continue operating if the other is degraded. This allows us to roll out changes safely, with one zone running the new version while the other continues serving traffic.
This design also improves resilience to cloud provider incidents and traffic surges. Each availability zone uses a different sharding scheme, which reduces the blast radius when a single customer generates unusual traffic patterns. If one zone overflows, the other continues operating normally.
Integrate with Datadog's alerting and monitoring systems
To make completeness data actionable, we've integrated it directly into Datadog's monitoring and alerting systems. The completeness signal feeds into our incident response workflows, alerting on-call engineers when data completeness drops below configured thresholds.
Because completeness is measured per customer and per product, we can route alerts to the right team. If metrics ingestion completeness degrades, the metrics team gets paged. If APM completeness drops, the APM team responds. This specificity reduces noise and ensures that the right people are informed when their systems need attention.
Engineers can also query completeness data directly through Datadog dashboards, allowing them to correlate completeness degradation with other signals during incidents. This helps answer questions like: "Did data loss correlate with this latency spike?" or "When did completeness recover?"
Conclusion
Data completeness at Datadog's scale required us to rethink how we measure reliability in distributed systems. By breaking pipelines into segments, tracking payloads with unique identifiers, and aggregating measurements mathematically, we built a system that provides real-time visibility into whether our customers' data is complete.
The system's design prioritizes reliability over everything else. It runs independently of the pipelines it monitors, has minimal external dependencies, and can continue operating even when critical infrastructure fails. This allows us to answer the question "Is the data complete?" with confidence, whether we're investigating an incident at 3 a.m. or enabling AI agents to make safer automated decisions.
As Datadog continues to scale and as more workflows become automated, the importance of accurate completeness measurement only grows. The system we've built provides the foundation for the next generation of observability tools that can reliably act on the data they receive.
Fetched July 11, 2026