Datadog describes how they built MCP tools for Cloud SIEM, focusing on scoping tools around user behavior patterns and managing the shared context window with progressive disclosure and query-based bulk triage.
Datadog Blog
Mon
Wed
Fri
JulAugSepOctNovDecJanFebMarAprMayJunJul
LessMore
Releases143Avg44/moVersionsv2.0
Guide covers tracking proxy traffic and latency, detecting anomalies and security threats, building dashboards and monitors, and correlating Apigee X metrics with logs, traces, and the rest of the Google Cloud stack.
Datadog has been named a Leader in the 2026 Gartner Magic Quadrant for Observability Platforms for the sixth consecutive year, and was positioned highest in Ability to Execute.
Guide covers where agentic token costs come from, how to control them through tool catalog pruning, session history compression, and retrieval deduplication, and how to make token costs visible with instrumentation.
AI agents can reason through tasks, call tools, and adapt their next steps based on intermediate results. That flexibility is useful for building agentic applications, but it also creates security risk at runtime: A prompt injection attempt can change the agent's instructions, a…
As .NET Multi-platform App UI (MAUI) becomes the default cross-platform UI framework in the Microsoft ecosystem, many teams are standardizing on it to build mobile applications for iOS and Android. However, observability has not…
DASH 2026 brought thousands of engineers, builders, security professionals, and technology leaders to New York City for 2½ days focused on building, operating, and securing modern systems.
Static application security testing (SAST) tools are intentionally conservative. Traditional scanners identify code that appears exploitable and flag the snippet for review, even when protections elsewhere in the application prevent exploitation. Although that approach helps…
A lesson we've learned in experimentation at Datadog is how easy it is to fall into interpretative pitfalls even when following rigorous conventions. For example, consider an experimentation program that appears to do everything right on the surface. The team pre-determines…
When a customer gets paged at 3 a.m., they expect the graphs in Datadog to show the full picture of the data they sent. When an AI agent, such as one making autoscaling or remediation decisions, acts, it relies on the same assumption.
Engineering teams spend much of their incident response time investigating the problem and coordinating the response. Both tasks become harder when telemetry data lives in one place, deployment history is stored in another, and conversations unfold across chat channels and…
At Datadog, we want our developers to become better at using AI tools with the end goal of building quality software, faster, that generates real value. This includes not only the products and features that our customers use, but also the internal tools that help keep our…
Datadog launches Agent Observability toolset, MCP Server, Pup CLI, and Agent Skills for debugging and evaluating AI applications from inside coding agents like Claude Code, Cursor, and Codex CLI. Includes skills for session classification, trace root-cause analysis, and eval bootstrapping from production traces.
Datadog has acquired Adaptive ML, a startup whose Adaptive Engine platform enables enterprises to fine-tune open models using reinforcement learning and synthetic data generation. The acquisition aims to combine Datadog's observability data with Adaptive ML's expertise in building specialized AI agents.
New blog post outlines five common pitfalls when measuring developer experience in the age of AI, including equating AI adoption with efficiency and measuring individual output instead of system health. Draws on DORA research, JetBrains and Atlassian surveys, and Datadog's internal engineering experience.
Datadog for Government achieved GovRAMP High authorization, adding NIST 800-53 Rev. 5 security controls for state and local government organizations. The authorization builds on Datadog's FedRAMP High certification.
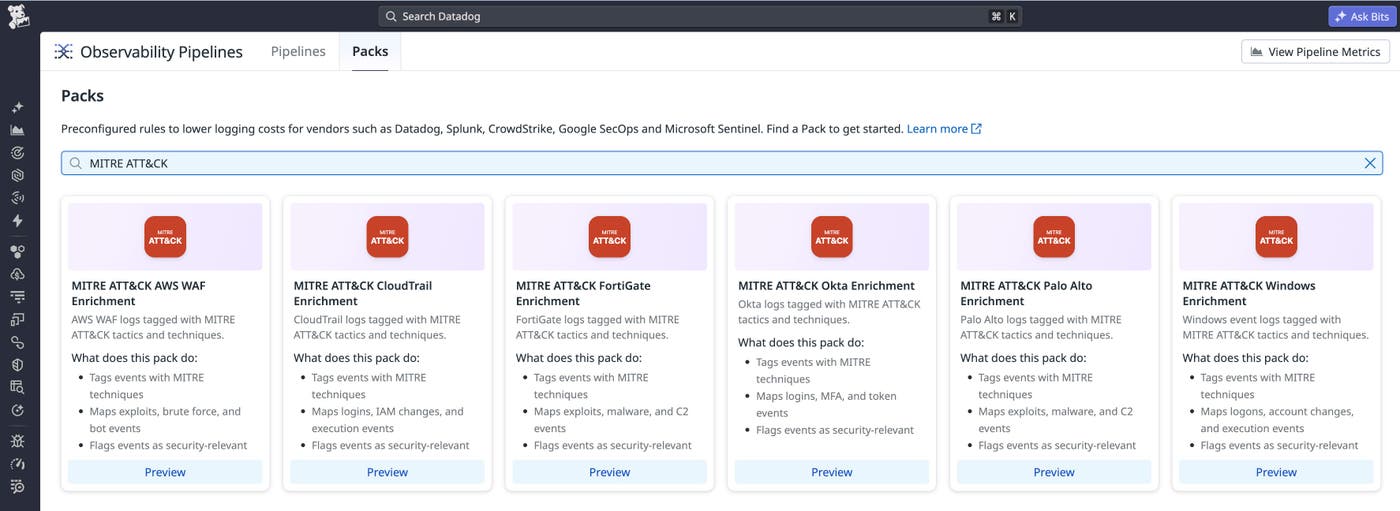
Set of guidelines for federal agencies adopting the OMB M-26-14 risk-based logging framework, with rules on continuous monitoring, 6-month searchable and 12-month retrievable log retention, and CISA maturity milestones. Explains how Datadog's Flex Logs, Cloud SIEM, and unified platform accelerate compliance through agent-based, agentless, and OpenTelemetry collection.
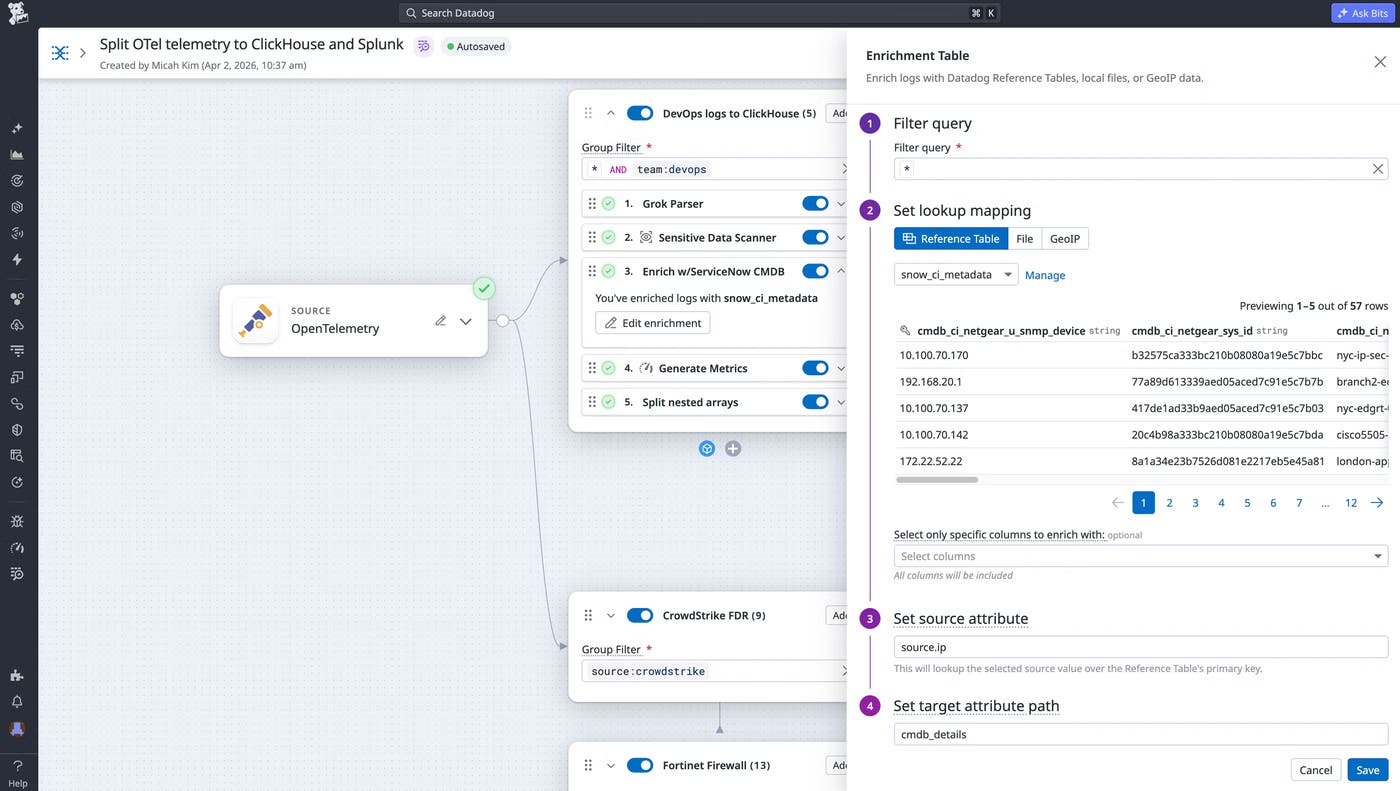
Blog post describes using Observability Pipelines to route high-volume CDN edge logs to low-cost object storage while sending key metrics to Datadog, and using Archive Search to query archived logs without indexing every event. Covers prebuilt Cloudflare and Akamai pipeline packs, in-transit metric generation, and PII redaction.
Datadog's internal Rapid team cut idle compute costs by more than 50% in its first data center rollout by adopting Datadog Kubernetes Autoscaling, eliminating over $3 million in annualized spend. The multidimensional scaling tool consolidated manual horizontal and vertical autoscaling configuration into a single resource.
Last Checked
4h ago
Latest
Jul 17, 2026
Source
www.datadoghq.com/blog