Query Insights now graphs any metric; sparklines go to detail
1 feature1 enhancementThis release1 featureNew capabilities1 enhancementImprovements to existing featuresAI-tallied from the release notes
From the original release noteView original ↗
Query Insights pages now include a new graph tab that lets you plot a time series of any of the available query metrics. Pick a metric from the tab's dropdown — total, CPU, and I/O time, rows read and returned, block cache hit ratio, bytes returned, and more — and see it as a full-size graph over the selected time range.
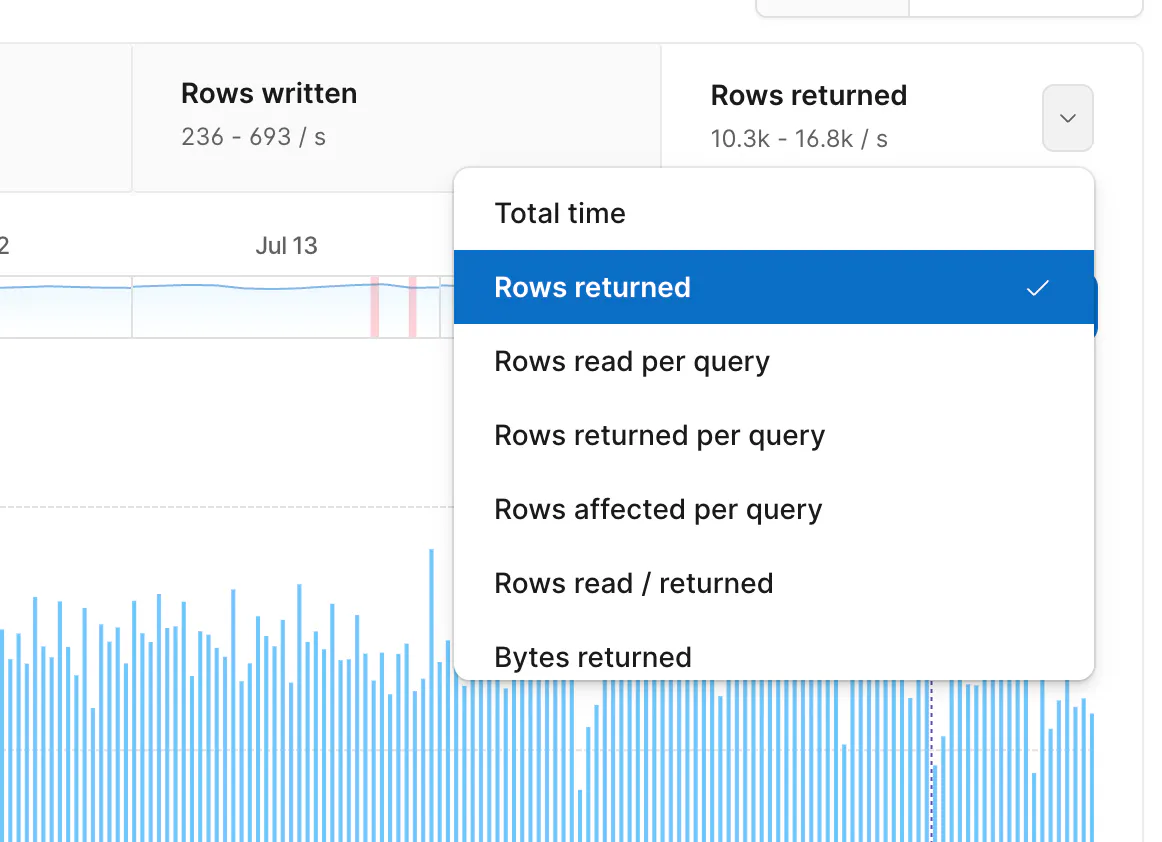
Sparklines in the query table are now clickable, too: clicking one takes you directly to that query pattern's detail page with the corresponding metric already selected. This makes it easy to go from an overview of every query your database is running to a detailed view of a single one for further investigation.
Fetched July 15, 2026