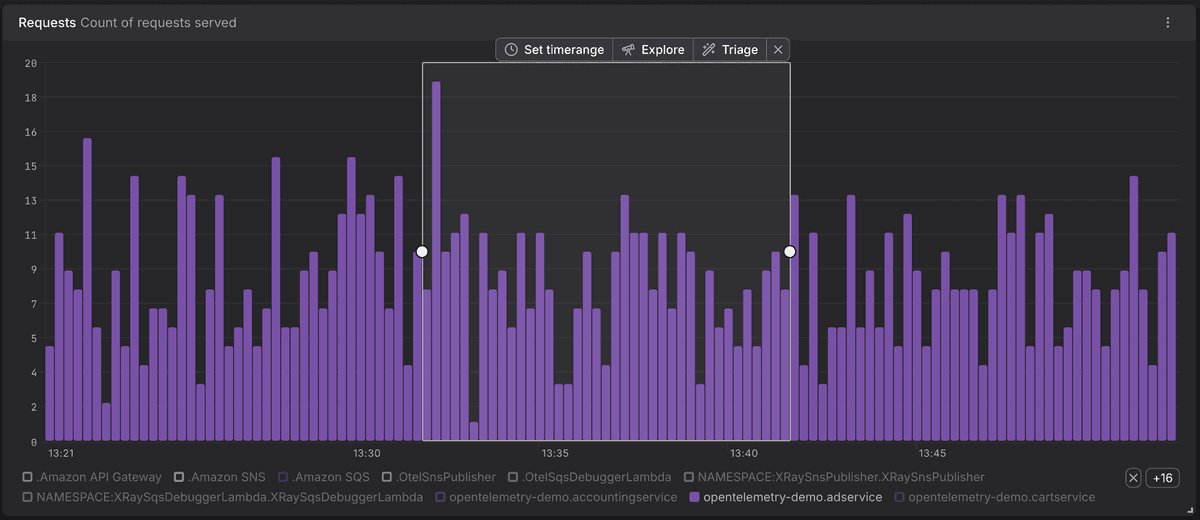
Drill Down from Any Chart — Straight to the Data Behind It
When you spot something unusual in a chart — a sudden spike in a logs chart, a latency outlier, an error rate climbing on one service — the next question is always the same: which records actually caused this? Dash0 now gives you a direct way of answering this question. Select a time range or on a chart, click a pie segment, or click a stat value, and an action bar appears with Explore and Triage actions that take you straight into the matching signal explorer with filters and time scope already applied.
What's New:
- Inline drilldown from any chart — Time-series, pie, gauge, stat, and tree-map charts now drill straight into the records behind them.
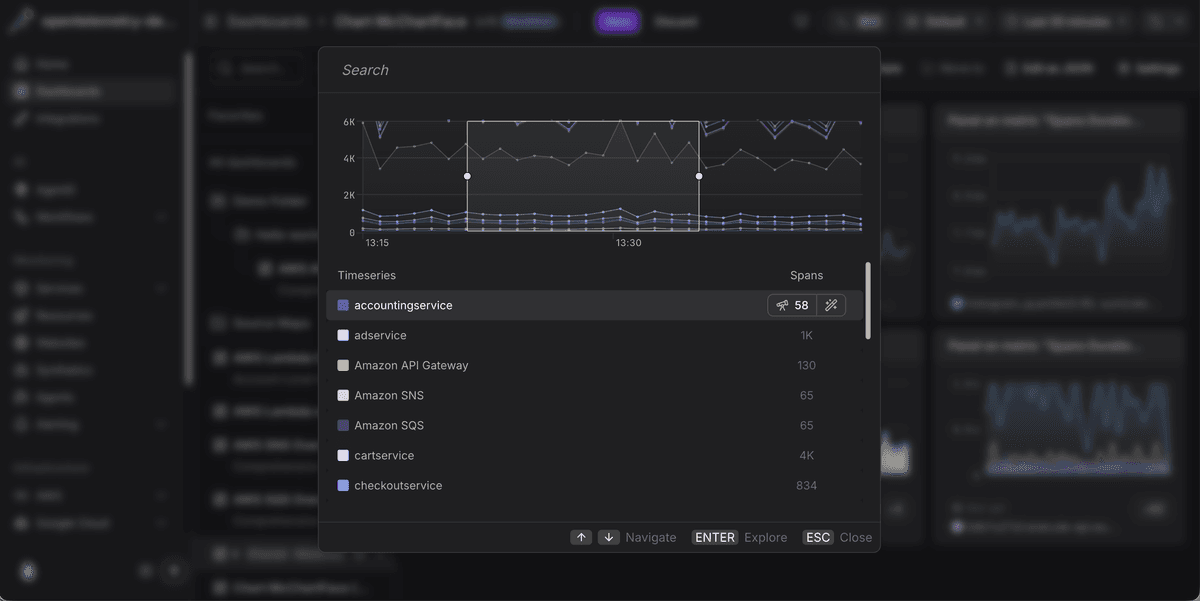
- Searchable picker for multi-time-series charts — Charts with many series open a dialog with live counts of matching records per series and full keyboard navigation.
- Per-(series × signal) drilldowns — Multi-series and multi-signal charts produce independent drilldowns, each scoped to its row's labels and its signal's filters.
- Explore and Triage modes — Read records with Explore, or surface what differentiates them with Triage. Available for spans, logs, and web events.
- Filter and time-range carry-over — Filters from PromQL and series labels and your selected time range follow you into the destination explorer with no manual setup.
Fetched May 15, 2026