Query & Dashboards: analytics for your Trigger.dev data
Trigger.dev has launched Query & Dashboards, enabling users to analyze task data using SQL-style queries or custom dashboards with visualizations.
TRQL Query Language
- SQL-style language compiling to ClickHouse for analytical queries
- Two queryable tables:
runs(status, timing, costs, machine type, tags, metadata) andmetrics(CPU, memory, custom OpenTelemetry metrics) - Built-in functions:
timeBucket()for time-series aggregation,quantile()for percentiles
AI-Powered Query Assistant
- Natural language query generation — describe desired data in plain English
- Automatic error detection with "Try fix error" suggestions
- Schema-aware responses handling cost analysis, error breakdowns, and duration percentiles
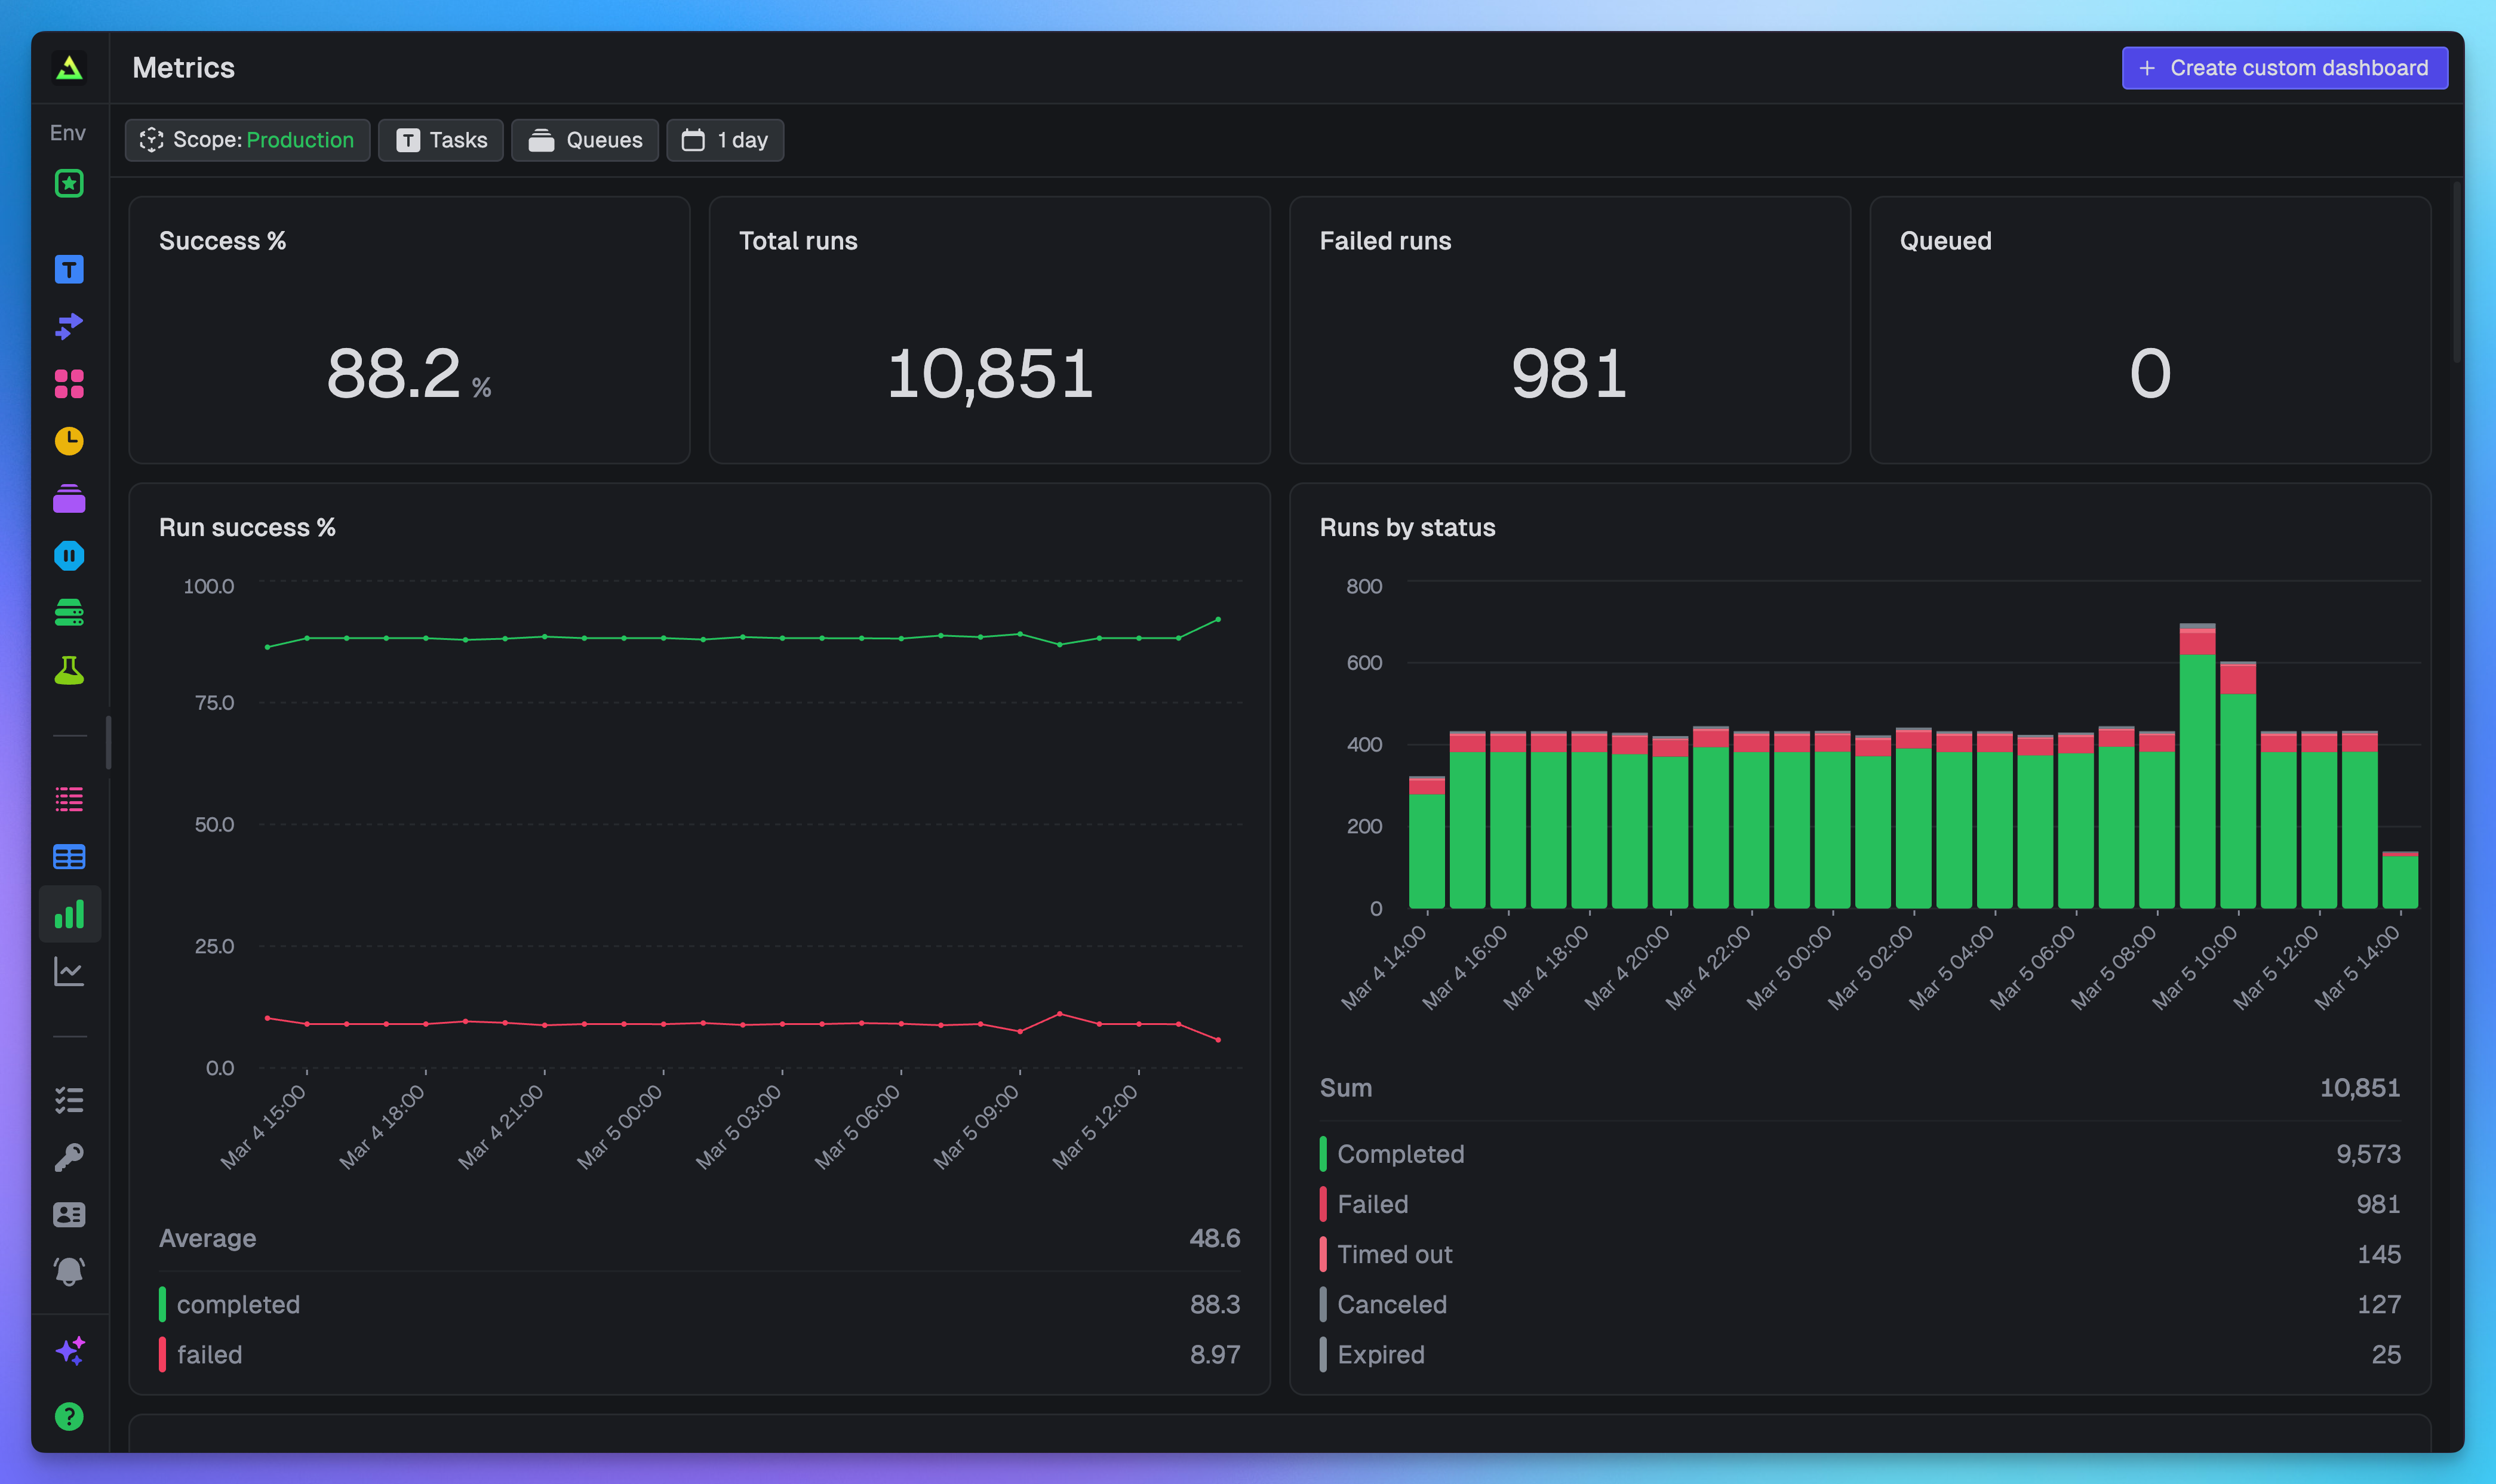
Pre-Built Dashboard
Automatic project dashboard covering: run volume, success rates, failure analysis, costs (by task/machine), and deployment version metrics.
Custom Dashboard Widgets
- Big Numbers: Single-value KPIs with customizable formatting (abbreviations, prefixes/suffixes)
- Charts: Bar, stacked bar, line, and area charts with automatic zero-filling and intelligent time bucketing
- Tables: Sortable, detailed breakdowns with column reordering and filtering
- Layout: Drag-and-drop arrangement on 12-column grid, auto-saving
Real-Time Filtering
- Time (presets + custom ranges), task selection, queue filtering, scope (environment/project/organization)
- Applied simultaneously across all dashboard widgets
- Auto-refresh every 60 seconds
SDK & API Integration
query.execute()function for type-safe queries withQueryTableautocomplete- REST API endpoint for custom views, monitoring tool integration, and AI agent debugging
Fetched June 3, 2026