Spark costs cut 44% with AI-assisted job optimization
Spark jobs only get more expensive and harder to debug as they scale. It's a problem we've run into ourselves. Our Referential Data Platform team builds and maintains the knowledge graph that maps relationships between customers' observability entities. ServiceQueryEdge is at the center of that graph, mapping service entities to their associated metric and log queries. It runs daily across seven datacenters, with individual partitions processing up to 27 TB of input and 16 billion records. At that scale, we were averaging $1.5k of infrastructure costs daily, with each run taking over 17 hours.
AI agents seemed like a natural fit for this problem. They're good at reasoning over code, connecting symptoms to root causes, and generating hypotheses quickly. But an agent working from code alone is still guessing. It needs to know what's actually slow.
In this post, we'll walk through how we used Datadog's Data Observability Jobs Monitoring and an AI agent built on Claude to debug and optimize ServiceQueryEdge. We'll cover what worked, what didn't, and the specific changes that cut our daily compute costs by 44% and reduced run duration by 60% in US1, our largest data center.
Closing the gap between Jobs Monitoring and the codebase
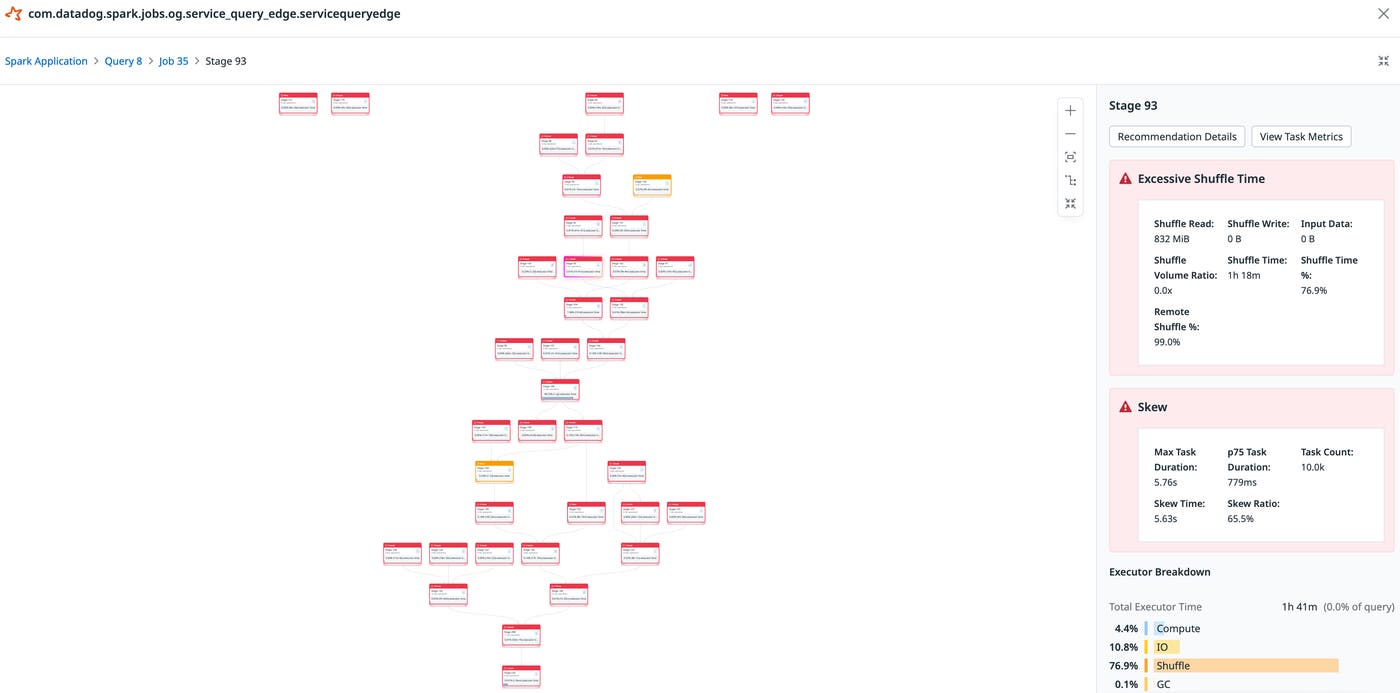
To understand where inefficiencies are, we rely on Jobs Monitoring with the Spark SQL Plan to get a visual, interactive representation of the full execution plan. However, even with that visibility, correlating a slow operator in the SQL Plan back to the relevant section of application code can still take time, particularly for a large, complex job like ServiceQueryEdge.
To speed up debugging, we built an AI agent to surface any bottlenecks across the execution graph and suggest fixes. We created a custom prompt structure that ingests the same data shown in Jobs Monitoring, such as stage metrics, the SQL execution plan, and telemetry data, alongside the source code. This allows the agent to perform correlation work that would usually fall on one of the team's engineers, saving up to hours of manual investigation. For every issue the agent flags, the engineer lands directly at the relevant node with context on why it matters.
Getting signal from noise: scoping data for AI-assisted debugging
At first, we ran into problems with Claude depleting its context while making Model Context Protocol (MCP) calls through our Datadog MCP Server to collect Spark data from Jobs Monitoring. The agent pulled job run telemetry data, represented as traces, using the get_datadog_trace, apm_search_spans, and apm_explore_trace tools. Multiple runs made the problem worse. The agent exhausted its context window before completing meaningful analysis. Suggestions became incomplete or incoherent.
We alleviated this by using subagents that delegated the acquisition of specific information into targeted tasks, preserving context for the analysis work that actually mattered. Agent output quality depended less on data volume than on how precisely that data was scoped.
However, the agent's initial suggestions didn't work. Many recommendations were either off target or addressed symptoms rather than root causes. For example, the agent suggested pruning column reads to reduce data read in, which was redundant because Spark had already handled that optimization.
Our first instinct was to try reducing the noise by feeding deeper embeddings of Spark runtime info and metrics from Jobs Monitoring into the agent. The additional context helped the agent identify more issues and generate more recommendations. But false positives also increased significantly.
Our next step was to add another subagent that filtered issues we deemed irrelevant or perfunctory. The validator works as a grader rather than a generator. It pulls the same context as the main agent, job health and the SQL plan, but its job is to find reasons a proposed fix won't work.
Optimization #2: Apply spam filter before the main join (line 766)

  Contraindication Checks:
  1. ❌ Does the spam filter actually reduce significant rows? — The LeftAnti join outputs 3,406,939,340 rows — same as the left input (3,406,939,340 from the Exchange). This means the 628 spammy metrics contribute near-zero rows to the 3.4B total. The spam filter removes metrics by (org_id, metric_id) but the main join key is (org_id, metric_name). Even if these 628 metrics were removed earlier, the 3.4B metrics-side of the main join would barely decrease.
  2. ✅ Is the filter already applied before the main join? — Looking at the data flow: metricsWithTagsRaw → spam filter → metricsWithTags → salt → metricsWithTagsSalted → main join at line 766. The spam filter IS already applied before the main join in the code.
  3. ❌ Would earlier filtering help? — The spam filter requires a groupBy($"org_id", $"metric_id").agg(countDistinct(...)) over the full metricsWithTagsRaw. This aggregation itself is expensive. Moving it "earlier" doesn't change the fact that you need the full dataset to compute the counts.
The validator's output looks like a peer review. For each suggestion, it lists checks using metrics from Jobs Monitoring and the code. If most checks fail, we discard the suggestion before wasting engineering time. The validator caught that many of the agent's top suggestions came down to implementing optimizations Spark was already doing automatically.
From theory to improvement: What actually worked
With the validator in place, we concentrated on the issues that passed scrutiny. Three optimizations proved most impactful: salting, join reordering, and broadcast hints.
Optimization 1: Salting
The SQL plan showed a 65.5% skew ratio on a large join. Salting is a technique to artificially add randomness to join keys to distribute data more evenly. It's a well-known mitigation but can introduce overhead.
The agent and validator had a back-and-forth about this one. The agent correctly identified skew on the service-metrics join. The validator confirmed that this specific join was neither broadcast nor pre-partitioned, so skew was a real problem. The implementation was standard: add salt values to both sides of the join on the service side, which already had ~1TB of memory at that stage of execution.
Result: 24% reduction in executor time on that stage
Optimization 2: Join reordering
The execution plan had a chain of joins where smaller intermediate results were being joined last, after building up massive datasets first. The agent suggested reordering to put smaller-cardinality joins earlier in the chain.
Here the validator was skeptical. It checked whether the join keys changed and whether reordering would trigger repartitions. Since these joins shared keys, reordering was safe.
Result: 15% reduction in overall execution time
Optimization 3: Broadcast hints
For one join involving a 500 MB mapping table, the agent recommended a broadcast hint to send the small side to all executors instead of shuffling both sides. The validator confirmed the size threshold was appropriate and the join type supported broadcasting.
Result: 8% reduction in executor time on that specific stage
Combined, these three changes cut daily infrastructure costs by 44% (from $1.5k to roughly $840) and reduced job runtime from 17 hours 20 minutes to about 7 hours in our largest data center. Other improvements came incrementally but summed meaningfully.
What we learned
Data matters more than volume. At the beginning, we pumped massive amounts of trace data into the agent. It wasn't helping. Once we narrowed the scope—focusing on slow operators, stage metrics, and the surrounding code—suggestions became concrete and actionable.
Validation is essential. The biggest breakthrough came from adding a second agent to validate claims. Engineers spend a lot of time on rabbit holes chasing optimizations that don't help. A validator that reasons backward from "would this fix actually improve the metric?" saves that time.
Jobs Monitoring provides the critical context. SQL plans, stage metrics, and executor metrics are what let an agent make informed recommendations. Without them, an agent is guessing based on code patterns alone. With them, it can connect symptoms in the runtime to their causes in the codebase.
Agentic AI is most useful for the correlation work. We didn't use the agent to write optimized code. We used it to surface possibilities that the team then evaluated and refined. That's where the leverage is: finding the high-value problems and putting the right person in front of the data to solve them.
For organizations running large-scale Spark workloads, the combination of Jobs Monitoring and agentic AI can compress what would normally be hours or days of manual profiling and debugging into a workflow where an engineer stays focused on evaluation and impact.
If you're running Spark jobs and want to see bottlenecks the way we do, get started with Datadog's Data Observability or explore how Bits AI Agents can help with troubleshooting.
Fetched June 2, 2026